Content Marketing for Pharmaceutical Companies: Unique Challenges & Opportunities
Ready to turn pharma content into a strategic growth engine? If your content is educating without converting, publishing without direction, or getting stuck in disconnected workflows, it may be time to build a strategy that connects insight, execution, and commercial impact.
Book a CallAsk what pharma marketing means and you will hear about rep visits, congress booths, and TV ads that end with a fast-spoken list of side effects. That machine is real, and it is enormous. It is also only half the picture.
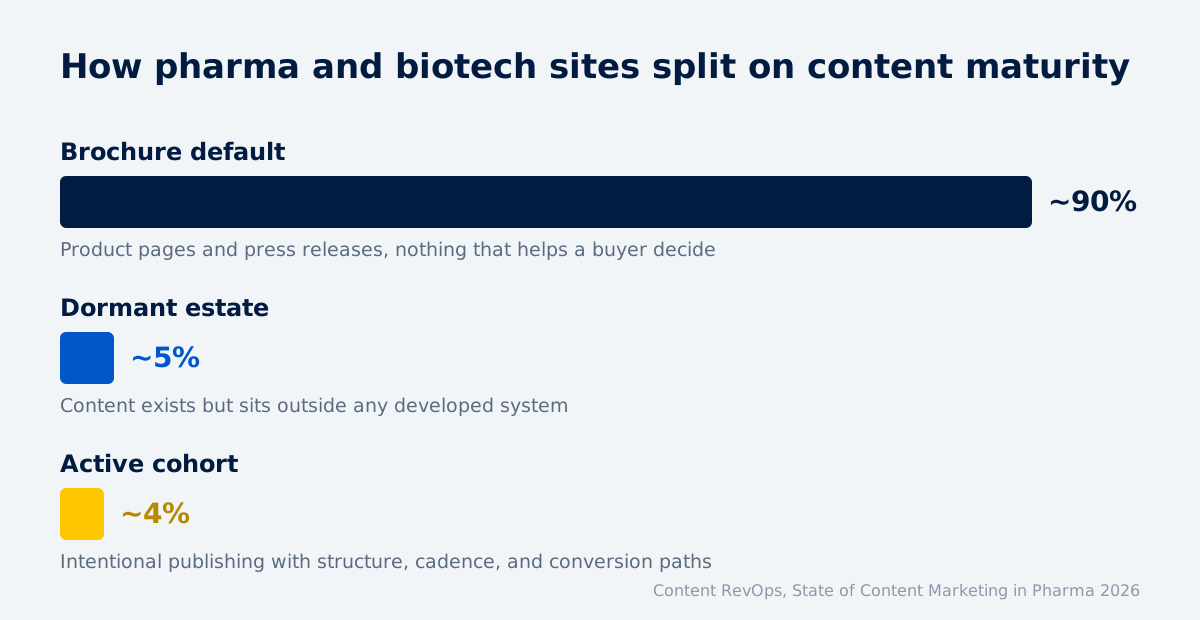
The other half barely exists. In our analysis of pharma and biotech websites, about 90 percent show no meaningful signs of content marketing. Only about 4 percent run an active, intentional system.
That gap is the subject of this guide. Content marketing in pharma is a working revenue function, not a branding exercise, and almost nobody in the industry runs it that way. The brochure default is a choice, not a lag forced by regulation.
Here is what the data says, why the industry defaults to the brochure, what the active few actually build, and where to start.
What is content marketing for pharma?
Content marketing for pharma is the practice of publishing useful, credible content on the open web that builds an audience of buyers and clinicians, captures their demand, and feeds pipeline. Articles, guides, research, tools, and video all count. Content is one channel among several a pharma company can run on the open web, and the rest of them are covered in digital marketing for pharma.
It works for drug manufacturers, biotechs, CDMOs, lab suppliers, medical device makers, and the service companies that sell to all of them. Our guide to content marketing for life sciences takes the same question across the whole sector. And it is worth separating from what the industry usually calls marketing, because the two run on different budgets, different teams, and different rules.
Drug promotion is the machine everyone knows
Conventional pharma marketing is promotion. A JAMA analysis of US medical marketing put the total at $29.9 billion a year, and most of it went to healthcare professionals, $20.3 billion, including $5.6 billion for prescriber detailing and $13.5 billion in free samples.
Consumer drug advertising, at $6 billion, is the visible tip. Promotional spending still runs above $20 billion a year, and direct-to-consumer drug advertising is legal in exactly two countries, the United States and New Zealand. Everywhere else, promotion means talking to prescribers.
The content engine is the machine almost nobody built
Content marketing answers a different question. Promotion pushes a product to an audience someone else assembled, at a congress, in a clinic, on a channel. A content engine assembles your own audience, then converts it. For the clinician half of that audience, that work has its own shape, set out in HCP content marketing for pharma.
The hiring data shows how foreign this still is. In our review of pharma marketing job posts, congresses and scientific meetings appear in about 1 in 7 postings. Content marketing, as a named discipline, appears in about 1 in 45.
This guide is about that second machine, because it is where the leverage now sits.
How much content marketing does pharma actually run?
Very little, and far less than the rest of B2B. Our analysis sorts pharma and biotech websites into three tiers.
Tier | Share of sites | What it looks like |
Brochure default | ~90% | Product pages, an about page, a press release archive. Nothing that helps a buyer decide. |
Dormant estate | ~5% | Some content exists, but it sits outside any developed system. Raw material without a strategy. |
Active cohort | ~4% | Intentional publishing with structure, cadence, and conversion paths. |
The scarcity runs format by format. Across all sites we analysed:
- A blog exists on about 1 in 17 sites.
- Case studies appear on about 1 in 21.
- Webinars, the highest-converting format in mainstream B2B, run on about 1 in 29.
- Downloadable resources sit on about 1 in 21.
- Structured technical documentation exists on about 1 in 43, so buyers who need depth end up trusting a third party instead.
Now the contrast. In the latest Content Marketing Institute benchmark, 97 percent of B2B marketers say they have a content strategy, and 76 percent staff a dedicated content team or person.
So pharma is not slightly behind the B2B norm. It runs a different operating model altogether, and our cross-vertical study of B2B content marketing shows how unusual that is even among conservative industries. That reframes the opportunity. In most categories, content is a crowded arms race. In pharma, the shelves are empty, and a company that publishes seriously in its niche competes with almost nobody.
Why does pharma default to the brochure?
Three forces produce the 90 percent, and regulation is the least important of them.
Pharma hires marketers to orchestrate, not to publish
Read enough pharma marketing job posts and a clear archetype emerges. Cross-functional collaboration appears in about 78 percent of postings, the single most demanded skill. Nearly 1 in 2 titles carry Director, VP, Head of, or Chief. Explicitly entry-level roles sit around 1 percent.
The craft is missing from the same dataset. Copywriting appears in about 1 in 22 posts, and medical writing in about 1 in 29. That is a structural gap, not a talent one, and it is why working directly with in-house SMEs matters more in this category than in almost any other.
Put those together and the shape of the function appears, a senior coordination layer. Pharma hires its marketers to run brand planning, to align medical, legal, market access, and sales, and to manage the agencies who do the actual making. That shape is specific to therapeutics, and what the life science marketing function owns looks very different in tools and diagnostics, where the same title often means writing the technical content rather than commissioning it. It is worth being precise about what a content marketing expert actually does before assuming the existing team covers it.
Practitioners describe the job the same way, days of meetings and PowerPoint, agencies producing the assets, and performance arriving as a high-level readout rather than something the team operates on. When the assets come from outside, who makes them shapes the output as much as the brief does, which is why we reviewed the demand generation agencies working with life sciences companies and what each one can prove. Which of them fits depends on which of three jobs you are actually hiring for, and how to choose a pharma marketing agency works through that first.
A function shaped like that can run campaigns. It cannot easily grow an owned audience, because audience building needs continuous in-house publishing, and nobody in the building owns that muscle.
The review process taxes every asset
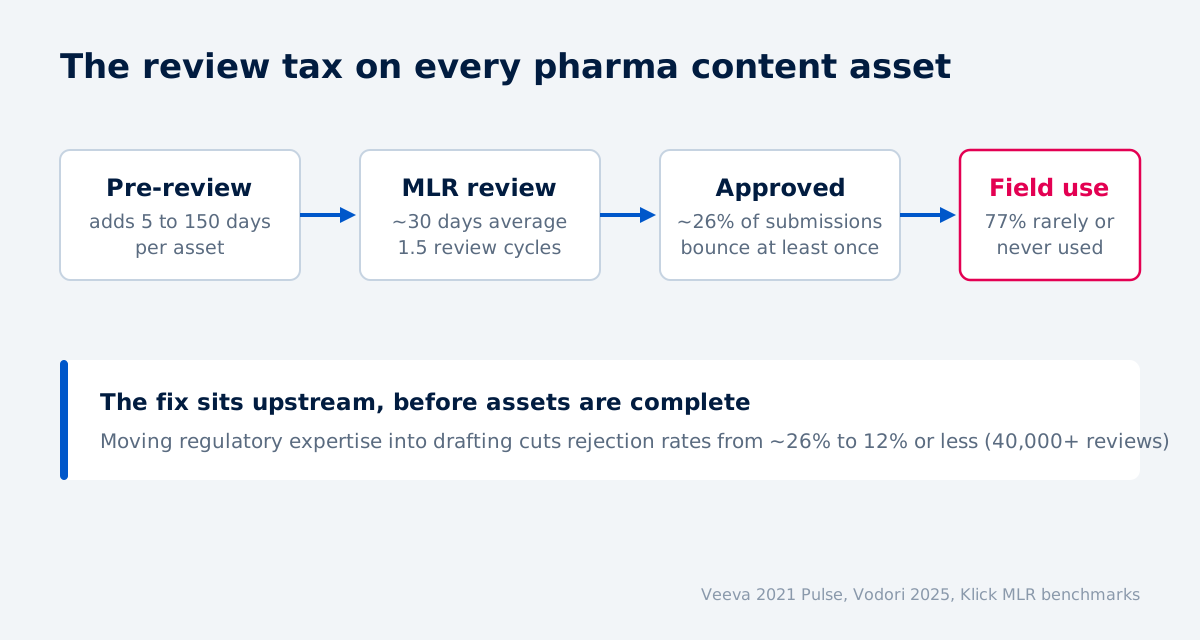
The medical, legal, and regulatory review, MLR, is the second force. The US industry average runs about 30 days from submission to approval, across an average of 1.5 review cycles. The pre-review stages before submission can add anywhere from 5 to 150 days per asset.
The friction is uneven. In Vodori's 2025 promotional review benchmarks, marketing reviewers approve 79 percent of assets on first circulation, while legal approves just 56 percent. Marketers feel this as unpredictability, the same asset sailing through one month and bouncing the next.
Here is the finding that matters most. Klick analysed more than 40,000 MLR submissions across 110 pharma clients and found the industry-average rejection rate of about 26 percent falls to 12 percent or less when regulatory expertise moves upstream into drafting, with pre-cleared claims libraries doing much of the work. Settling that claims posture and your review speed up front, instead of discovering them asset by asset, is the second and fourth of the five decisions in our pharma marketing strategy playbook.
Their conclusion, in their own words, is that rework rates are "a process outcome, not a regulatory inevitability." Planning content shapes around the review capacity you actually have, rather than around the campaign calendar, is one of the five decisions behind a life science marketing strategy.
One more number completes the picture. Field teams rarely or never use 77 percent of the content that survives review. Teams brief assets against brand plans and campaign calendars rather than against what reps and buyers actually need, so the work clears review and then sits in the asset library. The industry pays a heavy review tax on content nobody uses, and no regulator wrote that rule. Briefing against a real validated theme is what stops that waste at the source.
The compliance excuse does not survive contact with the active cohort
Regulation is the reason everyone gives, so test it against the companies that publish anyway.
Inside the active cohort, about 90 percent publish regulatory content and about 78 percent publish compliance-focused content. The most regulated topics in the industry are the ones the publishers cover most.
A working minority proves compliant publishing every week, with claims discipline, credentialed authors, and review workflows built for cadence. What actually blocks the rest is the operating model and the review workflow, and both can change.
What does the pharma content funnel look like when content does exist?
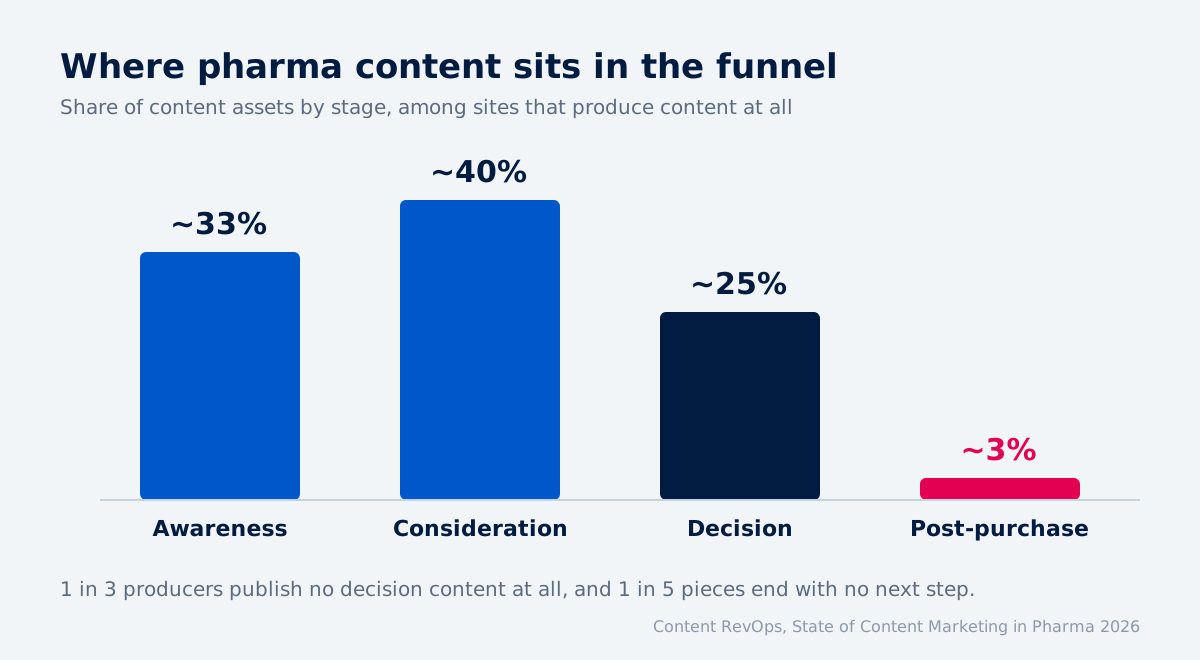
Front-loaded, leaky, and invisible exactly where buyers decide. Among the sites that produce content at all, the funnel shape in our analysis looks like this:
- Awareness carries about a third of all content assets. Pharma's educational instinct is real, and teams build this layer first.
- Consideration holds about 40 percent, healthier than expected.
- Decision content drops to about a quarter, and roughly 1 in 3 producers publish no decision-stage content at all.
- Post-purchase content, adherence, onboarding, and expansion, sits near 1 in 30 assets.
Two architecture failures compound the shape:
- About 1 in 5 content pieces end with no next step at all, no CTA, related link, or gated asset. The reader finishes and leaves.
- Only about 45 percent of active-cohort sites run funnel-segmented CTAs; the rest attach the same generic ask to every post, whether the reader arrived curious or ready to buy.
That first failure is the most common reason a well-read library produces nothing, and it is the same pattern behind blogs that pull traffic but never generate demos. Fixing it is a design job, not a writing job, which is why we treat mapping the funnel and building the conversion layer as separate, deliberate steps.
Search visibility mirrors the content. About 95 percent of the keywords pharma ranks for are top of funnel, with roughly 2 percent at the bottom, so commercial-intent searches default to third-party review sites.
Branded terms tell the same story from another angle. They make up about 1 in 8 of ranked keywords yet drive about 4 in 10 of all traffic, which means most measured "SEO performance" is people who already knew the company. The audience-expansion lever, non-branded search, sits mostly unused. The stage-by-stage benchmarks behind these numbers, and where the leaks sit, are laid out in how the funnel works by the numbers.
The practical takeaway runs opposite to instinct. Most pharma companies that decide to invest in content start by producing more awareness assets, the layer they already over-serve. The higher-return move is finishing the funnel that exists, decision content, next steps, and intent-matched CTAs, before adding anything new at the top.
Under 1 in 12 pharma sites run a CRM
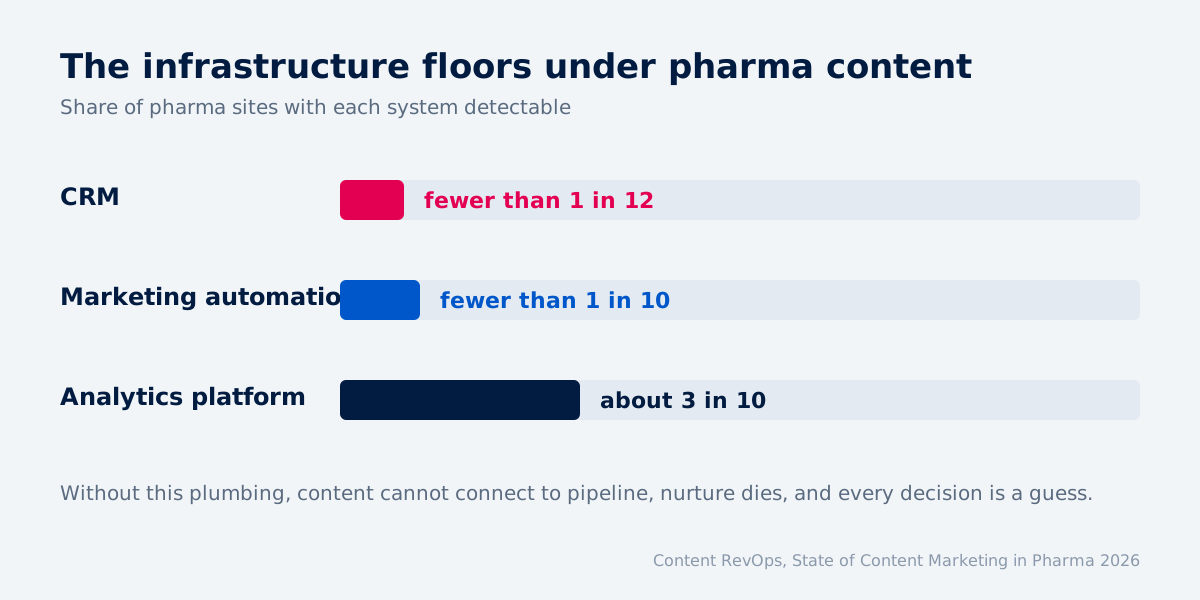
Infrastructure is the ceiling nobody talks about, so here are the floors of the industry's stack from our analysis:
- A detectable CRM runs on fewer than 1 in 12 pharma sites. Even at $500 million-plus revenue, adoption reaches only about 29 percent.
- Marketing automation runs on fewer than 1 in 10, with HubSpot leading at about 10 percent.
- An analytics platform is detectable on about 3 in 10 sites.
- WordPress powers about 37 percent of sites, a governance question as much as a CMS choice once 21 CFR Part 11 expectations enter the room.
These are the prerequisites, and their absence explains why content investments die downstream, and why connecting pharma content to pipeline is a plumbing job before it is a reporting one:
- Without a CRM, content cannot connect to pipeline, so nobody can prove what it earned, and nobody can see which page started the deal.
- Without marketing automation, a captured lead gets one email instead of a nurture sequence, and content drips become content one-shots.
- Without analytics, every decision is a guess, and reporting on content success collapses into traffic screenshots.
This is also why omnichannel remains a slideware word in most of the industry. Orchestrating a governed message across rep, email, event, and portal assumes an identity layer, a CRM, and automation underneath. Most companies are two purchases short of the sentence in their strategy deck. The plumbing itself is a build, covered in automation architecture, lead capture and qualification, and lead nurture and database reactivation.
The sequencing lesson is blunt. The first content-marketing investment in pharma is usually measurement and plumbing, because everything after it compounds and nothing before it can be proven. The wider discipline is the same one behind RevOps best practices in any B2B category.
Can pharma win in AI search?
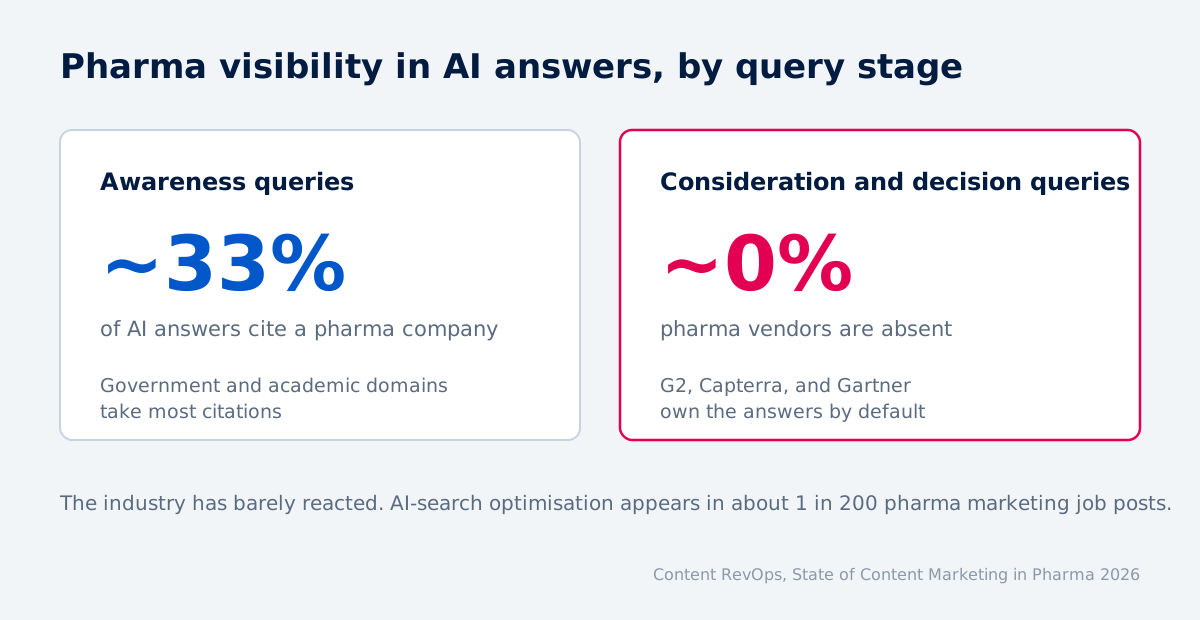
At the top of the funnel, pharma already shows up. At the decision stage, it is absent, and the decision stage is where revenue lives.
In our testing of AI-generated answers, pharma companies appear in about 1 in 3 responses to awareness-stage queries, with government and academic domains, FDA, NIH, and ClinicalTrials.gov, taking most citations. For consideration and decision queries, pharma vendors appear in about 0 percent of answers. G2, Capterra, and Gartner own that layer by default.
The demand side makes this urgent rather than theoretical:
- Pew Research tracked real browsing behaviour and found that when an AI summary appears, clicks on traditional results drop from 15 percent to 8 percent of visits, and 26 percent of users end the session entirely.
- The same study found government sites appear as AI-summary sources at three times their rate in standard results, independent confirmation of the trust bias our probes found.
- Among physicians, 92 percent now use generative AI in clinical practice, with ChatGPT at 83 percent, and 73 percent say AI influences their clinical decisions, including comparing drugs within a category.
- On the buying side, 51 percent of B2B software buyers now start research in an AI chatbot, and 69 percent changed vendor preference because of what an AI told them.
The audience moved into the answer layer. The industry has not followed; AI-search optimisation appears in about 1 in 200 pharma marketing job posts. If you rank on Google and still never appear in an assistant's answer, the structural reasons are covered in why your brand does not show up in ChatGPT or Perplexity.
What earns AI citations in a conservative category
AI engines apply a trust filter to medical topics, and the filter reads like an E-E-A-T checklist. The levers are specific:
- Structured HTML over PDFs, with question-shaped headings and liftable answers. Doing that without gutting the page for humans is its own craft, covered in optimizing for AI Overviews without wrecking the page.
- Named, credentialed authors. About half the active cohort displays MD or PhD credentials, and about 2 in 3 publish under named authors.
- Original research and proprietary data. Engines keep citing it because proprietary numbers are non-substitutable; any answer that needs the figure must return to the source. Only about 29 percent of the active cohort publishes any, a pattern our study of why one brand gets cited while a better-known competitor is ignored found across every vertical.
- Presence on the third-party review sites that already own decision answers. Engines assemble those answers from review-site listings, so being listed well is how a vendor enters answers it cannot yet win with owned pages.
None of this requires a rule change. It requires deciding that visibility in the answer layer is a commercial asset and building for it, before the head start disappears. Whether that needs genuinely different content or just better-structured content is answered in do I need different content for AI search visibility, and the mechanics of the build are in how we help you show up in AI search.
What does content as a revenue function look like?
It looks like a funnel designed before anyone briefs a single piece of content, and a system where every asset has a job in that funnel. We think the order matters more than the volume. Plan top-down, publish bottom-up:
- Theme. One validated commercial and educational problem carries the next 3 to 6 months.
- Raw assets. SME interviews, first-hand research, and internal case material supply the substance.
- Core asset. One cornerstone per cycle, a report, deep guide, or benchmark, does the heavy authority work.
- Interactive assets. Webinars, tools, and checklists turn interest into engagement and contacts.
- Supporting assets. Blogs, social, and email drive traffic back toward the higher-intent layers.
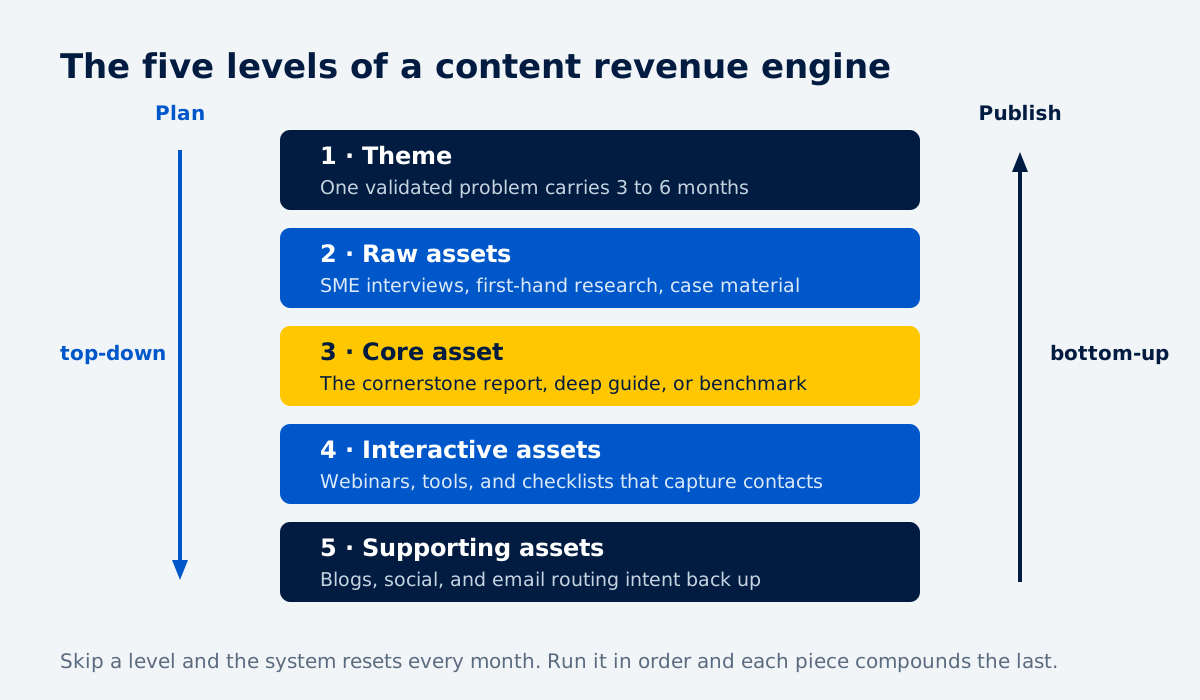
Skip a level and the system resets every month. Run it in order and each piece compounds the last.
The clearest way to show it is an engagement we ran with Westlab, a life science manufacturer selling to laboratories.
Their growth engine was manual, cold calls, conferences, and lab visits, a high-effort, high-CAC motion. Their real differentiator, deep consulting expertise about lab operations, lived entirely inside the sales team, re-delivered one lab at a time.
So the work was extraction and packaging, and the education became the product. We built the Zero Downtime Lab, an education-led program anchored on the day-to-day problems lab managers actually fight, with problem-specific guides and downloadables as the capture layer.
Lab managers came in as collaborators rather than targets, through webinars and co-created flagship pieces. We enriched every lead before it reached a rep, and hub engagement signals told sales who was genuinely serious.
In three months, the system generated 241 inbound leads in a market that had run on cold outbound, lifted site traffic 205 percent in a narrow technical niche, influenced $120k in quotes, and returned 869 percent on the content investment. Forty educational pieces shipped in the first two months through a human-plus-AI production pipeline, so cadence never depended on heroics.
The same pattern repeats across the sector, and the sector-wide numbers sit in our state of content marketing for life sciences study and on our life sciences page.
Research beyond our own work documents the mechanism. 6sense's buyer research, replicated across two years, finds B2B buyers run about 70 percent of the journey before first seller contact, initiate that contact 83 percent of the time, and hand the deal to their pre-contact favourite in 80 percent of cases. Early sales outreach before that point does not raise win rates.
In a category where the buyer researches alone and the shortlist forms in private, the education layer is the sales motion for most of the journey. Westlab's content did the trust-building its reps used to do one meeting at a time, which is why the return showed up in quotes and cycle length rather than vanity metrics.
Where should a pharma company start in 2026?
Start from your revenue stage, sequence infrastructure before volume, and treat the budget bands below as directional anchors rather than prescriptions. For calibration, Gartner's 2025 CMO survey puts marketing budgets at 7.7 percent of revenue overall, with pharma among the industries above 9 percent.
Revenue stage | Modelled annual marketing budget | First moves |
Under $1M | $150K to $350K | Website, scientific PR, LinkedIn. Content and SEO as foundation, not project. |
$1M to $10M | $500K to $1.2M | First CRM. Basic analytics. One problem-led content cluster. |
$10M to $50M | $2.5M to $5.5M | Marketing automation, nurture, funnel-segmented CTAs, decision content. |
$100M to $500M | $18M to $35M | Full stack. Original research, AI-search positioning, multi-format publishing. |
Whatever the stage, the sequence holds:
- Fix measurement first. CRM, analytics, and automation, because until content connects to pipeline, every renewal conversation about the program is a matter of faith.
- Finish the funnel you have. Add next steps to dead-end pages, match CTAs to intent, and build the decision content most producers skip.
- Then build the audience layer. A problem-led cluster in your niche, credentialed authors, and one piece of original research, the asset that compounds authority and AI citations for years.
- Position for the answer layer early. Structured pages, real authors, and third-party presence, while the industry has barely begun hiring for the discipline.
Distribution decides how far each of those travels, and most pharma teams under-build it; the channel logic is in developing a content distribution strategy. If you are the executive sponsoring this rather than running it, the CEO's guide to B2B content marketing covers what to expect and what to ask for.
The spread between doing this and not doing it is not marginal. Within every revenue band we analysed, the top-performing companies generate roughly 100x more organic traffic than their same-size peers. The gap is strategic, and it compounds for those who commit.
The 90 percent is a choice. So is joining the 4 percent, and right now the ticket is the cheapest it will ever be. If you want to know where your own site sits against these benchmarks, a content revenue audit will show you the gaps, and what they cost, in numbers your CFO can argue with.
Is your pharma content strategy actually connected to growth?
Build a research-led content operating system that aligns expertise, audience needs, and commercial priorities to drive trust and qualified demand.
Frequently Asked Questions
About the Author

Founder & CEO, Content RevOps
Stefan Kalpachev is the founder and CEO of Content RevOps, where he helps B2B SaaS companies transform their content into predictable pipeline. With a background in content marketing and revenue operations, Stefan has developed a unique methodology that bridges the gap between content creation and revenue generation.
Connect on LinkedInRelated Articles
Digital marketing for pharma, channels that actually move pipeline
Sep 9, 2026
Pharma marketing analytics and ROI, connecting content to pipeline
Sep 8, 2026
AI in pharma marketing, where it helps and where it is just language
Sep 7, 2026