Guide to Reporting on Your Content Marketing Success
Want content reporting your CFO will actually trust? Let’s build a pipeline-grade measurement system.
Book a CallIn B2B SaaS and professional services, content can’t be treated as a “brand activity” that gets a monthly traffic update, especially when it comes to reporting on content marketing success. Done well, it functions more like go-to-market infrastructure: an operating system that helps buyers self-educate, aligns internal stakeholders, triggers intent, and supports sales conversations. That matters now because buying journeys are longer, buying committees are larger, and prospects do most of their evaluation before they ever talk to your team, with many teams reporting that content marketing has become significantly more important to their overall strategy in the past year.
The problem is measurement hasn’t caught up to content’s strategic role. Many leadership teams receive activity reporting—pageviews, downloads, follower growth—without a credible link to pipeline, sales velocity, win rate, or revenue, even though mature programs consistently tie content to these commercial outcomes. The result is predictable:
Budget skepticism and stop-start investment
Teams optimizing for vanity metrics instead of business outcomes, despite growing evidence that over-relying on delivery metrics like clicks and impressions lowers overall effectiveness
Poor prioritization (“more content” instead of the right content that measurably advances buyers through defined stages)
Misalignment between Marketing, Sales, and Finance on what “working” means, especially when content performance data sits in disconnected tools rather than in a shared revenue view
This guide shows how to build a rigorous, business-facing reporting system that mirrors your pipeline and buying journey, uses attribution models that fit B2B reality, and turns content reporting into a tool for resourcing, strategy, and go-to-market decisions—so every major asset can be evaluated in terms of pipeline contribution, revenue influence, and ROI instead of surface-level engagement alone.
1. Start with Business Outcomes, Not Marketing Metrics
If your reporting starts with traffic, impressions, or “content produced,” you’ll end up defending activity instead of proving impact. Executives fund growth, not output. Industry studies show most marketers still default to campaign delivery and vanity metrics, even though reporting on business effects (pipeline, revenue, profit) correlates with significantly better commercial performance. A workable content reporting system begins with a small set of business questions, then back-solves which content signals are credible leading indicators—and which are just noise. This shift also forces standard definitions and shared ownership across Marketing, Sales, and RevOps, so your dashboards stop being “marketing’s view” and become the company’s view.
1.1 Define the business questions your reporting must answer
Most C-suites are trying to make four decisions: invest more, invest less, change the mix, or fix execution. Your reporting should answer:
How is content influencing pipeline created and closed revenue?
Is content shortening sales cycles or improving win rates when it’s present in the deal journey?
What is content doing to CAC, margin, and payback period across motions (inbound, outbound-assisted, ABM, partner)?
Where are we over- or under-invested across channels, formats, and themes?
If a metric can’t help answer one of these, it’s not an executive KPI—at best, it’s a diagnostic. Research on B2B content programs consistently finds that teams tying content to opportunity creation, deal velocity, and revenue are rated as more effective and are less likely to face budget cuts than those stuck on clicks and downloads.
1.2 Translate content’s value into four executive lenses
To prevent “content = blog traffic” thinking, report outcomes through four lenses leaders already use to evaluate initiatives:
Competency: fewer one-off sales decks, faster onboarding, higher reuse of core narratives. In many organizations, documenting content standards and workflows is the turning point where content starts to function as a shared competency instead of scattered activity.
Campaign: lift in paid and outbound performance when anchored by strong assets (landing pages, case studies, webinars). Multi-touch and position-based attribution frequently show that campaigns wrapped around robust content generate more qualified responses and higher campaign ROI than media alone.
Customer: retention, expansion, product adoption, and support deflection driven by education and thought leadership. Longitudinal studies of thought leadership programs show that when its impact is tracked beyond engagement—into pipeline, pricing power, and renewal rates—it becomes one of the most defensible content investments on the P&L.
Cash: pipeline influence, revenue contribution, CAC efficiency, and payback improvements tied to content touchpoints. Treat each major asset as a micro P&L line item—combining page-level or asset-level revenue with cost to produce and maintain—to harden these “cash” stories in language finance already uses.
1.3 Align incentives and ownership around outcomes
You won’t get clean reporting if teams are paid on different truths. Replace output goals with shared outcome goals, such as:
Content-influenced pipeline and revenue
Win-rate and cycle-time deltas for opportunities with meaningful content engagement
Renewal/expansion impact tied to post-sale content consumption
Make Marketing, Sales, and RevOps jointly accountable for the same numbers. That’s how you reduce channel silos and turn content from “marketing output” into a revenue operating system. Enterprise benchmarks show that organizations with unified, cross-functional measurement frameworks—and a single view of content’s impact across CRM, marketing automation, and web analytics—report higher marketing effectiveness and are better able to justify continued or increased content investment.
2. Build a Stage-Based KPI Map That Everyone Shares
If content reporting feels like “lots of data, little meaning,” it’s usually because Marketing is measuring outputs while executives are judging outcomes. A stage-based KPI map fixes that by making content performance legible across the buyer journey and the revenue journey—so Sales, Finance, and Marketing can debate decisions, not definitions.
2.1 Map the journey and sales stages first
Start by agreeing on one simple journey and aligning it to your CRM stages:
Awareness → Consideration → Evaluation → Decision → Post-sale/Expansion
MQL → SAL → SQL → Opportunity → Closed-Won → Expansion
This mirrors how most B2B teams say they structure their funnels in large benchmark studies on B2B content marketing trends.
Do this collaboratively with Sales Ops and Finance. Then document:
Stage definitions (what “counts” and what doesn’t)
Entry/exit criteria (the event that moves a buyer forward)
Typical content touchpoints (e.g., research report in Awareness, case study in Decision, onboarding hub post-sale)
Treat this as your shared measurement backbone, similar to the governance-first standards recommended in enterprise research on content effectiveness and measurement. It prevents pipeline arguments caused by mismatched stage logic and fragmented data.
2.2 Select one or two governing KPIs per stage
The goal isn’t to measure everything; it’s to choose the few metrics that set the right incentives and avoid the “vanity metric” trap many teams fall into when they over-index on impressions and clicks instead of business outcomes.
Awareness: prioritize qualified reach (ICP/account-fit traffic) and engaged attention (engaged sessions/return visitors, branded search lift). Benchmarks on branded search and audience growth from B2B content marketing outlook research can help you sanity-check what “good” looks like here.
Consideration: track content-assisted MQLs plus high-intent behaviors after content (e.g., demo-page views, webinar registrations, tool interactions). This is where many teams start to bridge the gap between “engagement” metrics and lead-stage movement.
Evaluation: focus on SAL/SQL influence and content touches per opportunity (did your sequences actually show up in real deals?). This aligns with research that shows mid-funnel assets like webinars and case studies are among the top-performing formats for opportunity creation.
Decision: measure opportunities with content present and win-rate / sales-cycle delta when key assets (case studies, workshops, webinars) are used. Studies on content-driven revenue show that opportunities consuming several pieces of late-stage content often have higher win rates and shorter cycles.
Post-sale/Expansion: tie content to onboarding completion/product education engagement and expansion or renewal influence (including health-score/NPS shifts where available). Enterprise benchmarks consistently link customer education content to retention and expansion outcomes, so this stage should not be an afterthought.
2.3 Standardize definitions, sources, and lookback windows
Publish a measurement playbook that specifies:
Exact KPI definitions (especially “content-influenced pipeline”)
Lookback windows by stage (e.g., 90 days pre-opportunity for influence)
Systems of record (CRM, marketing automation, product analytics, webinars/events, BI)
This mirrors the “governance-first” approach recommended in comprehensive content measurement guides that stress standard taxonomies, UTM discipline, and unified data schemas as prerequisites for reliable attribution.
One dashboard. One metric dictionary. One version of truth.
2.4 Connect this KPI map to operational decision-making
Treat the KPI map as decision infrastructure:
Awareness metrics guide targeting and top-of-funnel investment.
Consideration/Evaluation metrics shape nurture, enablement, and ABM orchestration.
Decision/Post-sale metrics inform sales process improvements and customer marketing priorities.
If a KPI doesn’t change a decision, it doesn’t belong in executive reporting. This matches ROI frameworks that rank metrics by their ability to inform pipeline, revenue, and efficiency decisions rather than just describe activity, as outlined in multi-touch and position-based models for measurable marketing impact.
Get a FREE Content RevOps Audit
Discover exactly where your content-to-pipeline gaps are and get a personalized action plan to fix them.
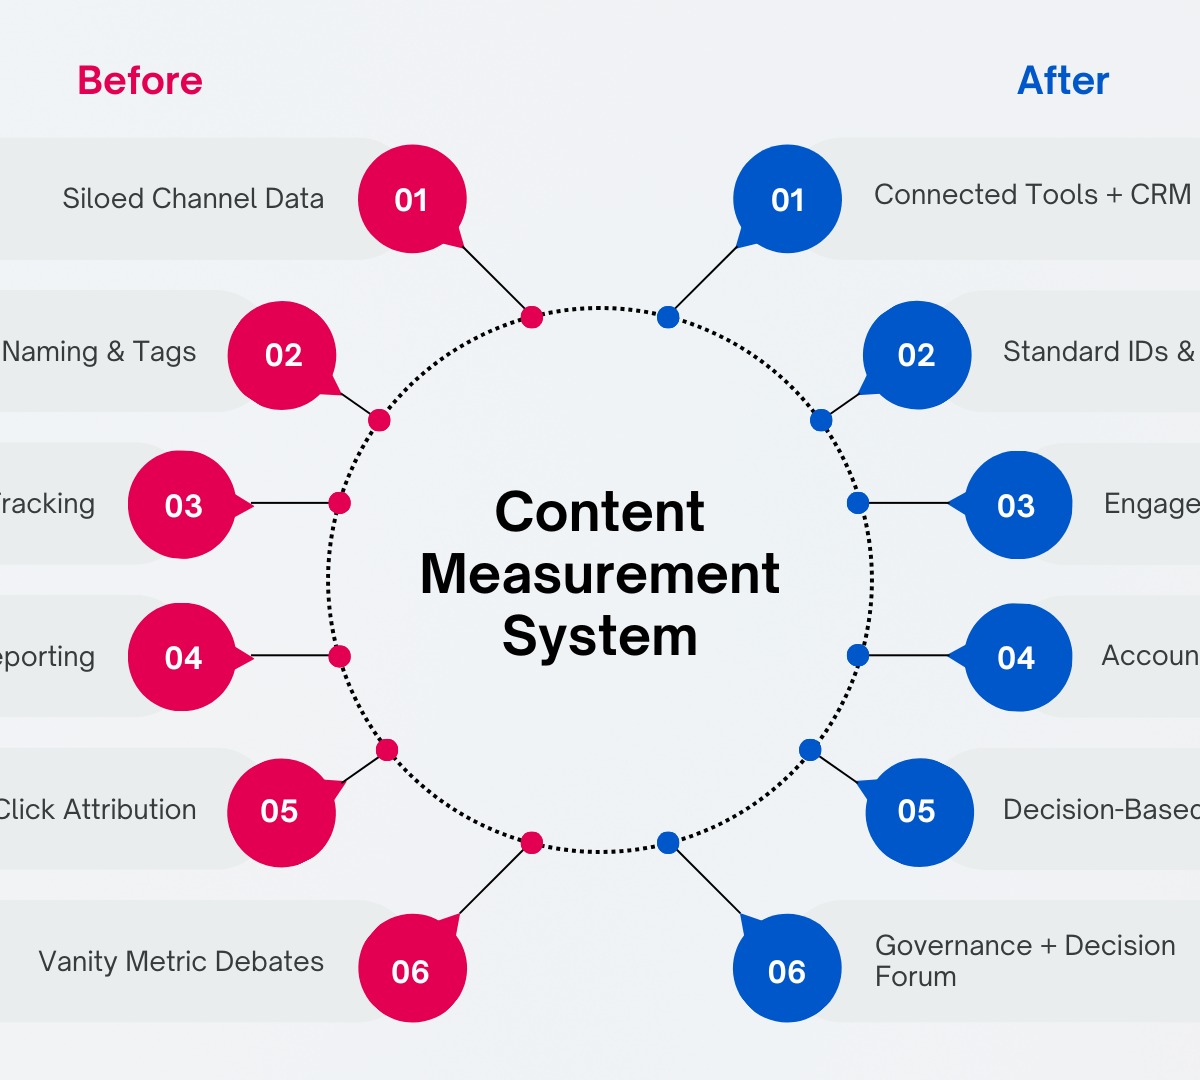
3. Instrumentation, Taxonomy, and Attribution That Fit B2B Buying
In B2B SaaS and Professional Services, content reporting breaks down for predictable reasons: long cycles, multiple stakeholders, offline touches, and revenue that continues after the first contract. Surveys of B2B marketers consistently show measuring content effectiveness near the top of their challenges, right alongside driving action and conversion. If your tracking and attribution assume a single click leads to a single lead, you’ll end up defending vanity metrics instead of proving business impact. The fix is to treat content like product infrastructure: consistent taxonomy, durable IDs, connected systems, and a small set of attribution models tied to the decisions you actually need to make.
3.1 Treat content like a product: taxonomy and tracking
A content taxonomy is nonnegotiable because it turns “what worked?” into a query, not a debate. Enterprise teams that rate their content marketing as effective are far more likely to have documented standards, workflows, and governance around content and data, not just more assets in market. Give every asset a unique ID and structured tags (topic cluster, persona, funnel stage, product, format, and use case like sales enablement, onboarding, or ABM). Store it in a master catalog that Marketing, Sales, and RevOps can all access—otherwise each team will report a different “truth.”
Tracking is the second half of the foundation. Standardize UTMs so campaigns can be compared cleanly, and instrument behavioral depth so you can distinguish “skimmed” from “actually evaluated.” Research on content measurement frameworks stresses that without this basic discipline—UTMs, naming conventions, and consistent tagging—multi-touch attribution and ROI analysis quickly fall apart.
Minimum viable instrumentation:
UTM conventions for every promotion (paid, email, social, partners)
GA4 (or equivalent) events for scroll depth/time thresholds, key interactions, and form submits
Consistent IDs for webinars, events, and offline touches mapped to CRM campaigns
Finally, connect the system. Your marketing automation, webinar, and event platforms must write campaign and touch data into the CRM. In many organizations, content performance is trapped in channel silos (email, events, web), which is exactly what broad industry ROI studies identify as the biggest barrier to seeing marketing’s true impact. For ABM, use a BI/CDP layer to stitch sessions and identities into account-level journeys, not isolated leads—especially important when you consider that buyers typically consume multiple high-value content types (case studies, webinars, research reports) before ever talking to sales.
3.2 Choose attribution models based on the decisions you need to make
No single attribution model can represent a multi-touch, multi-threaded B2B deal. Analysts who look across hundreds of campaigns find that over-relying on campaign-delivery metrics (impressions, clicks, opens) correlates with weaker business outcomes than focusing on response, brand, and business effects tied to revenue. The goal isn’t to “find the one true model,” but to use a few pragmatic models that answer different questions.
Operational, pipeline-level defaults:
First-touch / last-touch: channel hygiene and edge cases (what started or closed), not budgeting
U-shaped: strong default for demand gen (first engagement + lead creation get most credit)
W-shaped: best when opportunity creation is the pivotal milestone
Full-path: extends W-shaped through closed-won for longer cycles
Time-decay: useful for optimizing nurture sequences and content cadence
Advanced options (when tagging maturity and volume are high): algorithmic models to estimate touch contribution, plus quarterly-style approaches like mix modeling to capture non-clickable influence (events, PR, high-stakes case studies). Enterprise research shows that adding methods like multi-touch attribution and marketing mix modeling can lift measured business effects significantly over time, because they better reflect how early- and mid-funnel content shapes demand before the last click. For major pushes, incrementality tests (holdouts or audience splits) help answer the only question Finance ultimately trusts: “Did this cause lift?”
3.3 Account-level and post-sale attribution for recurring revenue models
Attribute at the account level, not the individual lead. Track engagement across the buying committee and report deltas that matter: committee engagement lift, opportunity creation rate, and deal velocity with vs. without content touches. In ABM and ABX programs, the teams that outperform are those that treat an orchestrated cluster of content, channels, and accounts as a single program and then measure lift in opportunity creation, deal size, and win rate at the account level—not just who filled out which form.
Also extend attribution beyond acquisition. In recurring revenue businesses, content influences:
Onboarding completion and product education
Renewal risk reduction
Expansion and cross-sell pipeline
Modern content revenue frameworks effectively treat each page or asset as a micro P&L: measuring not only direct conversions, but also assisted value and post-sale impact on churn, expansion, and LTV.
3.4 Establish governance and a decision forum
Measurement degrades without governance. Set data-quality SLAs across Marketing Ops, Sales Ops, and RevOps; document definitions and lookback windows; keep first-party data and privacy practices clean. Enterprise studies repeatedly link “advanced” data governance and reporting practices with higher self-reported marketing effectiveness—even more than new tools or additional headcount.
Then run a monthly attribution council (Marketing, Sales, Finance, RevOps) to reconcile model outputs and record decisions—so reporting becomes a steering wheel, not a retroactive justification. Treat dashboards and reports as products in their own right; teams that intentionally design them around specific executive decisions outperform those that simply assemble metric collections and hope stakeholders will infer the story.
4. From Dashboards to Decisions: What to Report to Whom
4.1 Separate monitoring from decision-making
Most content reporting fails because it mixes two different jobs. A dashboard is a stable instrument panel: it answers, “Are we on track?” A report is a decision document: it answers, “What should we do next?”
Dashboards: simple views, consistent definitions, trend-focused, minimal commentary
Reports: deeper analysis, tied to a specific choice (budget shifts, resourcing, pruning, experiments), updated on a set cadence or ad hoc
This separation is what turns content into operating infrastructure instead of a pile of metrics. In organizations that rate their content marketing as effective, this kind of structured reporting discipline is one of the top drivers of performance, alongside content quality and sales alignment. Executives don’t need more charts—they need clarity on revenue levers, trade-offs, and next actions.
4.2 Executive dashboards for the C-suite (monthly/quarterly)
Keep the C-suite view small and high-signal, mapped to business outcomes and sales motions. Your goal is to show how content changes pipeline quality and revenue efficiency—not how busy marketing was. That aligns with research showing that leadership teams care most about pipeline, revenue, CAC, LTV, and sales cycle length, not vanity metrics.
Include:
Content-influenced pipeline and revenue, segmented by motion (inbound, ABM, partner, expansion). Many B2B teams now distinguish between content-sourced and content-influenced opportunities to reflect multi-touch journeys instead of last-click bias.
CAC and payback period for content-led vs blended acquisition, treating each major content initiative as an investment with a P&L, not just a traffic source.
Win-rate and sales-cycle deltas when key content experiences are present (enablement, webinars/events, product education). Teams that track content’s impact on win rate and cycle time consistently report stronger business effects than those who stay focused on clicks and opens.
Health indicators that precede pipeline: brand/search lift, audience growth for thought leadership, engagement depth with product education. These are the measures that typically move first when content strategy improves, before revenue shows up.
Use clear targets and consistent lookback windows so performance can be interpreted without renegotiating definitions every meeting. Mature teams also standardize attribution lenses (for example, a position-based or W-shaped model for executive views) so year-on-year comparisons actually reflect reality instead of shifting measurement rules.
4.3 Operational dashboards for marketing and sales teams (weekly)
Weekly dashboards should answer: “Where is the funnel leaking, and which content is helping or hurting?”
Focus on stage conversion and cohorts:
Funnel conversion by content format and channel (webinars vs e-books vs case studies). Benchmarks consistently show formats like case studies, videos, and research reports over-index on consideration and decision outcomes, so breaking these out by stage is critical.
ABM account engagement (who is engaging, with what, and whether it correlates with stage movement). For account-based motions, account-level engagement with problem/solution content, proof assets, and experiential content is often a leading indicator of opportunity creation and deal size.
SEO/content hub rollups using a content value matrix (high, medium, low, net negative pages), classifying pages by direct ROI and assisted value rather than traffic alone.
These views should drive concrete adjustments: nurture flow fixes, messaging changes, sales enablement gaps, and stage-specific content builds. Teams that explicitly separate volume metrics (traffic, registrations) from value metrics (content-assisted SQLs, opportunity creation, influenced revenue) in their weekly views are better able to protect high-impact content even when top-line traffic is flat.
4.4 Decision reports for resource allocation
When money or headcount is on the line, use decision-grade methods, not last-touch snapshots. This is where you translate content operations into capital allocation arguments leaders can trust:
MMM and incrementality readouts to reallocate budget across channels and formats, especially when you need to quantify content’s contribution versus paid media in complex, multi-channel campaigns.
Prune/refresh proposals using page-level ROI, assisted value, and strategic importance (consolidate, refresh, retire). Treating each URL as a micro P&L—factoring in cost to serve, direct revenue, and assisted conversions—helps justify why some high-traffic but low-value content should be removed or consolidated.
Thought leadership and experiential evaluations tied to audience growth, citations, event-to-opportunity conversion, deal acceleration, and LTV impact. High-performing teams increasingly report on thought-leadership-influenced opportunities, win-rate uplift, and expansion revenue, not just downloads or attendees.
In practice, these decision reports combine quantitative attribution models (multi-touch, position-based, or test–control lift) with qualitative insight from sales and buyers. The objective is to create a repeatable system where content budgets, headcount, and roadmap priorities are defended with the same rigor as any other growth investment.
Conclusion
Reporting on content marketing success is not about proving your team is busy. It’s about seeing—clearly and consistently—how content functions as revenue infrastructure. When you anchor on business outcomes, standardize stage-based KPIs, instrument journeys with clean taxonomy and tracking, and use attribution models that match how your buyers actually decide, content stops being a cost center and becomes a controllable revenue lever—something echoed in longitudinal B2B research showing that better measurement and reporting correlate directly with higher perceived effectiveness and budget protection for content programs (example).
Mature reporting also marks an operating-model shift: content becomes a go-to-market layer that educates buyers, creates intent, and supports Sales before, during, and after the deal—while giving Marketing, Sales, Finance, and RevOps a shared language for performance and budgeting. Teams that make this shift typically move away from surface metrics and toward response, brand, and business effects such as pipeline and revenue influence, win-rate lift, and CAC efficiency (evidence; enterprise benchmarks).
At a minimum, your system should make these decisions obvious:
Double down: what’s compounding pipeline, win rate, or cycle-time improvements—e.g., content assets that repeatedly show up as first- or opportunity-creation touches in multi-touch or position-based attribution models (pattern seen in ROI-focused analyses)
Fix: what’s valuable but under-instrumented, under-distributed, or misaligned to stage—often exposed when content scoring or content-audit frameworks reveal strong engagement but weak contribution to qualified opportunities (approaches outlined here)
Stop: what looks active but doesn’t move revenue outcomes, such as high-traffic, low-conversion content that turns net-negative once cost to serve and maintain is factored in (a common pattern in page-level ROI analysis)
This is the lens behind how we build content systems: treat each asset like a product with a defined job in the revenue engine, and each report as decision infrastructure. That means pairing executive dashboards built around content-influenced pipeline, revenue, and efficiency with practitioner views that track traffic and engagement as diagnostics, not success criteria (dashboard and report design guidance). With the right foundation—standard taxonomy, disciplined data capture, and attribution logic that reflects real buying journeys—content efficiency improves over time without requiring ever-increasing spend, a trend reflected in multi-year B2B benchmark studies that link measurement discipline to sustained performance gains (for instance).
Is your content reporting proving revenue—or just activity?
Turn dashboards into decision infrastructure: stage-based KPIs, clean attribution, and a single source of truth for pipeline and ROI.
About the Author

Founder & CEO, Content RevOps
Stefan Kalpachev is the founder and CEO of Content RevOps, where he helps B2B SaaS companies transform their content into predictable pipeline. With a background in content marketing and revenue operations, Stefan has developed a unique methodology that bridges the gap between content creation and revenue generation.
Connect on LinkedInRelated Articles

How do I optimize content for AI Overviews without wrecking the page for human readers?
Jun 18, 2026

Do I Need Different Content for AI Search Visibility, or Will Strong SEO Pages Still Work?
Jun 18, 2026

What makes one brand get cited in AI answers while a better-known competitor gets ignored?
Jun 15, 2026