What Demand Generation Metrics to Track and Not to Track in 2026
Want demand gen reporting your CFO will believe? Build the pipeline-grade scorecard.
Book a CallMost demand generation programs still prove their value with activity: traffic, impressions, clicks, downloads, form fills, and lead volume. Those numbers are easy to collect and easy to grow. They are also often far from what leadership cares about: qualified pipeline, sales cycle movement, and revenue.
That gap creates real problems. Dashboards get inflated. Budgets go to channels that look efficient but produce weak opportunities. Sales teams lose trust when “leads” are not ready, not in-market, or not a fit.
In 2026, this is harder to ignore. Customer acquisition costs are rising, budgets are tighter, and teams have better data connecting campaigns, accounts, opportunities, and closed-won revenue. Demand gen now needs financial accountability, not just proof that activity happened.
This article uses a simple hierarchy:
Metrics to track religiously
Metrics to keep tabs on
Metrics to disregard as success measures
The goal is not to dismiss content, campaigns, or channels. It is to measure them by the work they do in the go-to-market system: educating buyers, qualifying demand, supporting sales, and moving accounts and opportunities forward.
Metrics to Track Religiously in 2026
If demand generation is meant to create pipeline, the main scorecard must sit close to sales outcomes. Activity still matters, but only as context. The metrics below show whether marketing is engaging the right accounts, creating real opportunities, moving deals forward, and influencing revenue.
From Leads to Accounts: Engaged ICP Accounts
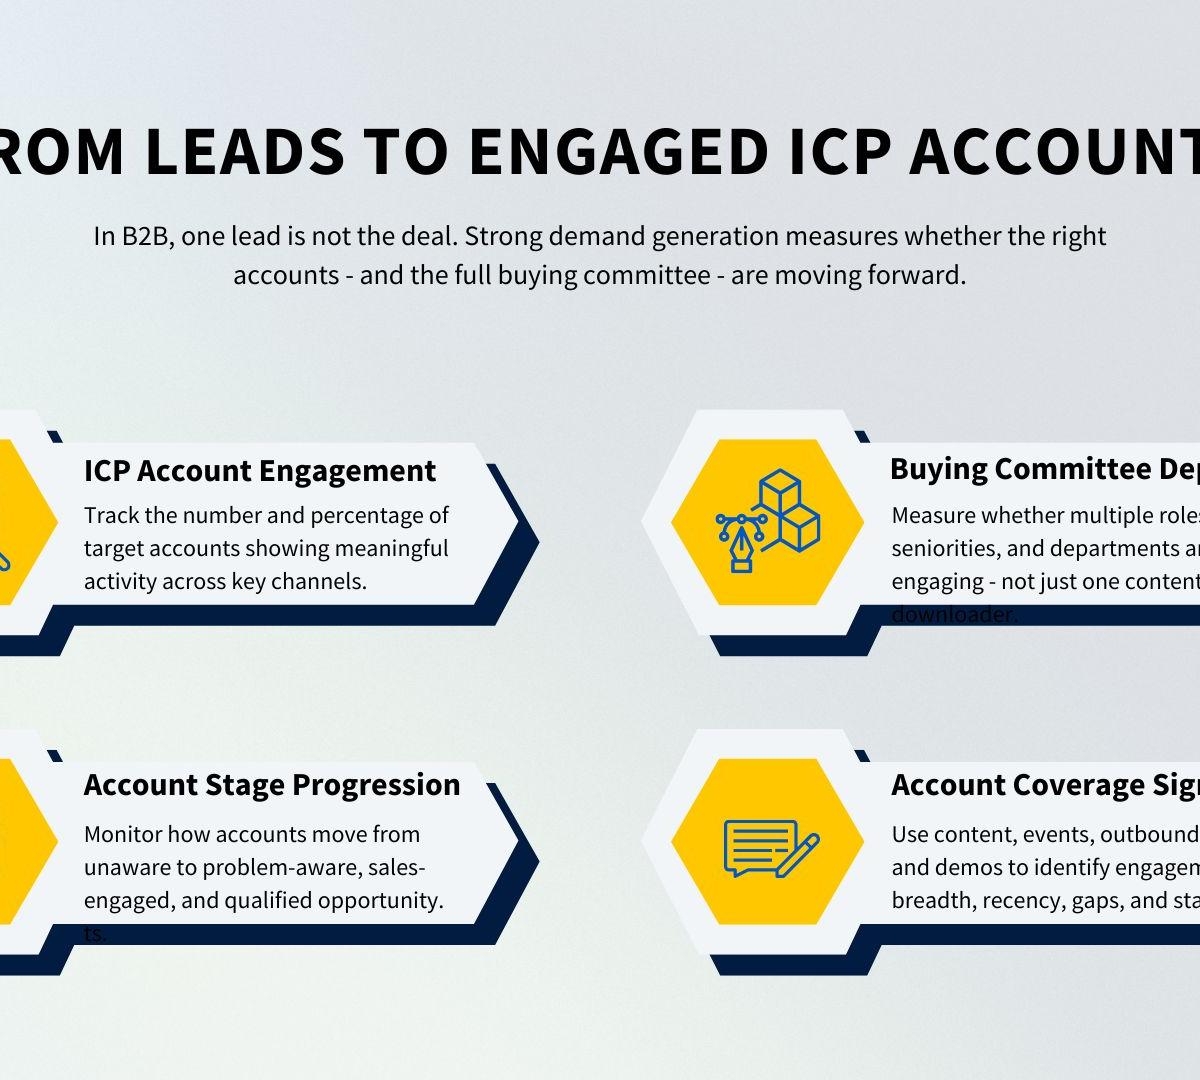
In B2B, the account is the buying unit. One person may download a guide, but a deal usually depends on users, budget owners, reviewers, and executives. Lead-level reporting can show interest from one person while hiding whether the buying group is actually forming.
An engaged account is an ICP-fit company with recent, meaningful, multi-threaded engagement across channels: site visits, content consumption, events, outbound replies, sales touches, or demos.
Track engaged accounts by:
Number and percentage of ICP accounts engaged.
Buying-committee depth: roles, seniorities, and departments involved.
Account stage progression: unaware → problem-aware → sales-engaged → opportunity.
Account snapshots: engagement breadth, recency, gaps, and signs of stalling.
This is where content becomes infrastructure. Content should not be judged only by traffic or downloads. It should be judged by whether it expands account coverage, pulls more of the buying committee into the journey, and moves accounts from passive research to active evaluation.
Sales Acceptance and Opportunity Creation
Lead volume is meaningless unless sales accepts and converts it. A campaign that creates 1,000 form fills but few sales conversations has created work, not demand.
Start with MQL-to-SQL acceptance rate: the percentage of Marketing Qualified Leads (MQLs), prospects who have engaged with your brand and are strong candidates for sales outreach, that become sales qualified leads after the sales team vets them as high-intent buyers worth pursuing. In a healthy system, many teams aim for roughly 70–80%. The principle is simple: low acceptance exposes weak targeting, lead quality, scoring, offers, or handoff rules.
This metric forces alignment on:
ICP definition and disqualification rules.
Behaviors that show real intent, plus the shared lead scoring model and qualification criteria trusted by marketing and sales teams.
Sales follow-up timing and routing.
Handoff SLAs and the rules used by the marketing and sales teams to pass leads cleanly between stages.
Tracking the transition from MQL to SQL helps align teams on ideal-customer criteria and improves handoff quality.
Then track opportunity creation rate: the percentage of MQLs or engaged accounts that become qualified sales opportunities. This is the first hard proof that marketing-created demand is becoming pipeline.
Together, these metrics diagnose common failure points. High MQL volume with low acceptance usually means bad targeting or offer strategy. Strong engagement with weak opportunity creation often points to slow follow-up, poor routing, unclear ownership, or missing sales context, while seamless handoff workflows reduce delays and preserve momentum for sales outreach.
Pipeline Quality, Velocity, and Win Rate
Marketing should co-own what happens after opportunity creation. If demand gen fills the pipeline with deals that rarely close, the issue may be poor-fit demand, weak positioning, missing proof, or late-stage content gaps. It also helps to watch average deal size as a quality check on pipeline.
Track opportunity-to-close rate, or win rate, for marketing-sourced and marketing-influenced opportunities. Win rate shows whether demand quality holds up through the full buying process. It also connects campaigns and content to late-stage progress: competitive comparisons, ROI tools, objection-handling assets, case studies, security content, and executive-ready proof.
Pipeline velocity matters too. Track:
Time in each opportunity stage.
average sales cycle length.
Stage-to-stage conversion rates.
In B2B, sales cycles often exceed two months, and a shorter sales cycle length usually signals better messaging, targeting, and sales alignment.
These numbers reveal friction and help forecast future revenue with more accuracy when paired with conversion rates. Slow first contact can make good demand look bad. Long time in proposal may signal pricing, procurement, or proof gaps. Stalled evaluation may show that reps need better enablement or that the buying committee is not broad enough, which also affects sales efforts and planning around the average sales cycle length from first contact to closed deal.
Content RevOps treats BOFU content, sales playbooks, and nurture streams as part of the revenue system. Their job is to shorten time in stage, raise win rates, and reduce customer acquisition cost, and stronger sales enablement makes it easier to turn buyer interactions into revenue outcomes.
Pipeline Influence, Revenue Impact, and ICP/Intent Lift
Pipeline influence measures how marketing touches contribute across the account journey. Use multi-touch, account-based attribution across channels: content, events, outbound, paid media, creator partners, sales sequences, demos, and in-person meetings.
Revenue impact is the real north star, with Marketing-Originated Revenue and Marketing Contribution to Revenue as key measures to track. Track:
New ARR or bookings from marketing-sourced and influenced pipeline, including the percentage and dollar amount of new revenue that can be traced to marketing initiatives and the revenue generated from those efforts.
Pipeline dollars created and pipeline coverage inside the ICP.
Revenue per influenced opportunity, alongside contribution to total revenue and total revenue contribution by channel or campaign.
Renewal, expansion, and upsell revenue supported by nurture or enablement content.
Also measure ICP and intent lift. If fit or intent targeting is working, SQL rate, opportunity rate, and win rate should improve against baseline. Hold the team accountable for ICP match rate in pipeline, not just total volume.
Connect offline conversions (CRM activity, calls, demos, field events, applications, and purchases) back to campaigns where possible. If a metric does not point to engaged accounts, opportunities, velocity, or revenue, it is a supporting stat.
Demand generation bridges the gap between initial brand awareness and concrete sales revenue, which is why these measures matter.
Metrics to Keep Tabs On (But Never Celebrate in Isolation)
Some metrics are useful, but incomplete. They help you spot friction, improve targeting, and tune campaigns. They should not be treated as proof of demand generation unless they connect to opportunities, pipeline, or revenue.
Conversions Within the Funnel
Lead-to-first-meeting or demo rate is an early signal. Conversion Rate measures the percentage of users moving from one funnel stage to the next, making it one of the key metrics for seeing whether marketing is attracting people sales can speak with and whether SDR follow-up is working. If the rate drops, the issue may be slow routing, weak messaging, poor qualification, or too many leads per rep.
Stage-to-stage conversion rates are also among the critical metrics because they show where buyers stall. Watch SQL to opportunity, lead-to-opportunity conversion rate, opportunity to proposal, and proposal to closed-won. Lead-to-Opportunity Conversion Rate measures the percentage of MQLs that transition into sales-qualified opportunities. A weak SQL-to-opportunity rate may point to bad scoring or low intent. A weak proposal-to-close rate may show gaps in proof, pricing clarity, or competitive positioning.
Depth of Engagement and Buying-Committee Signals
A single visit or download does not mean much. Depth matters more, so use behavioral data like repeat website visits and content consumption to judge engagement. Track repeat visits, high-intent page views, content consumed by role, meetings per account, and whether decision-makers are involved.
This helps sales prioritize by using intent signals and intent data to decide whether an account needs education or direct follow-up. One junior champion may need education. An account where the technical evaluator, end user, and economic buyer are all active may be closer to movement.
Use these signals to improve content design and support a more demand generation-driven approach to content:
Economic buyers need business impact and risk reduction.
Technical evaluators need implementation detail and proof.
End users need practical value and workflow clarity.
Channel Cost and Reach as Optimization Levers
Cost metrics are useful when they compare spend to outcomes. Cost per lead is total marketing spend divided by the number of leads generated. A lower CPL suggests your efforts are attracting potential customers at a sustainable cost. For example, if you spend $10,000 and generate 500 leads, your CPL is $20. Cost per engaged account, cost per SQL, cost per opportunity, and cost per pipeline dollar are stronger because they show whether spend is creating qualified demand and controlling marketing costs.
Still, efficiency should not replace impact. Close rate per channel shows which marketing channels turn leads into paying customers and surface the highest quality leads. A cheap channel that creates no opportunities is not efficient. It is just cheap.
Reach and frequency also matter inside your ICP. Deduplicated reach shows how many target accounts you are touching across channels. Healthy frequency helps create familiarity. But awareness only has business value when there is a path to capture, qualify, and measure its pipeline impact, contribution to total revenue, and support business growth.
Quality Signals in SEO, Email, and Operations
SEO should be judged by commercial intent, not total traffic. Track visibility, sessions, and conversions from buying-intent terms, solution pages, comparison pages, and problem-aware queries. Generic traffic can grow while pipeline stays flat.
For email and outbound, look past sends and opens. Replies, meeting acceptances, and thread depth are better signals of interest.
Operational metrics explain why good demand may not become pipeline:
Speed-to-lead, aging leads, and leads per rep.
ICP match rate and enrichment coverage.
Lead and intent scores calibrated against opportunities.
Treat them as diagnostic tests, not success without revenue movement.
Metrics to Disregard as Primary Goals (and Why They Mislead)
These metrics are useful only as diagnostics. If they cannot be tied to qualified accounts, opportunities, pipeline, or revenue, they should not define demand gen success.
Awareness Numbers Without Business Context
Impressions, views, and reach mostly reflect spend, distribution, and algorithm favorability. They do not prove buyer progress. Optimizing for reach often pushes teams toward broad, low-intent audiences. The report looks better, but budget moves away from likely buyers.
Traffic totals and keyword rankings create a similar trap. Chasing volume pushes content toward non-buyers and “how-to” visitors with no commercial intent. A smaller footprint in commercial-intent searches, problem-aware topics, and ICP accounts is more valuable than a large audience that never converts.
Clicks, Form Fills, and Raw MQL Volume
Clicks and CTR can help test creative, offers, and messaging. They should not be treated as demand. High CTR often signals curiosity, not intent. Optimizing for clicks can attract people who engage easily but do not match the ICP or move downstream.
Raw form fills and MQL volume are worse when quality is ignored. SDR queues fill with weak leads, connect rates fall, sales gets frustrated, and spend is wasted on names instead of opportunities.
No MQL metric should stand alone. Pair it with:
SQL acceptance rate
Opportunity creation rate
Pipeline value created or influenced
Closed-won revenue attribution
Without these checks, MQL volume is just database growth.
.jpg?width=1200&quality=75)
Flawed Attribution and Scoring Shortcuts
Single-touch attribution, especially last-click, rewards what is easiest to measure. It over-credits cheap bottom-funnel channels and under-credits demand creation from content, events, influencers, communities, and brand activity.
Use multi-touch, account-based attribution, and lift tests where possible. They are not perfect, but unified dashboards help align sales and marketing around a single source of truth for pipeline health and forecasting, making budget decisions less dependent on one misleading click.
Lead scoring has the same problem when it is not calibrated to revenue. Sales-marketing alignment is the foundation here, because aligning metrics depends on shared definitions, priorities, and systems. Unvalidated points become political artifacts, not decision tools. Check scoring against SQL conversion, opportunity creation, win rate, and revenue.
Rethinking “Success” for Creator and Brand Plays
Earned media value, social engagement, and promo code redemptions can under-credit creator and brand programs because these plays often influence earlier stages. They build memory, trust, and familiarity before a buyer converts.
Treat these numbers as context alongside engaged-account lift, pipeline influence, sales cycle movement, and revenue from influenced accounts. As primary goals, they mislead. As diagnostics, they can still help.
In 2026, demand generation measurement needs a clear hierarchy. At the center are the metrics that prove real commercial movement:
MQL-to-SQL acceptance
Opportunity creation
Win rate and sales velocity
Pipeline influence and revenue impact
Around that core sit diagnostic signals: clicks, visits, downloads, email engagement, channel costs, intent scores, customer lifetime value, and ROI as supporting demand generation KPIs when they connect clearly to revenue growth. These help teams troubleshoot targeting, content, timing, and handoffs. They matter, but only when they explain movement in the core metrics.
Customer lifetime value (CLV) estimates how much revenue a business can expect from a single customer across the full customer lifetime.
Customer lifetime value clv is calculated from average purchase value, average purchase frequency, and average customer lifespan.
A high customer lifetime value signals a healthier model, and the LTV-to-CAC ratio is a key metric for long-term profitability, with a common benchmark near 3:1.
On the outer ring are vanity numbers: impressions, raw reach, generic form fills, follower growth, and activity counts. They should never be goals.
The mindset shift is simple: stop proving that marketing is busy. Start proving that the go-to-market system is productive.
That shift takes more than a new dashboard. It requires shared definitions across marketing, sales, and RevOps; closed-loop data; and content built as infrastructure, mapped to stages, accounts, and buying jobs. Inbound, outbound, events, and nurture should all feed the same revenue-facing metrics.
That is how we design content and demand programs: one system, measured against pipeline, with reporting used to steer strategy through customers acquired, ROI, and how much revenue each program creates. ROI measures profitability by comparing revenue generated with investment cost, and it uses net profit divided by cost of investment, multiplied by 100, to assess efficiency. Teams that adopt this model will defend budgets more easily and improve pipeline quality, sales efficiency, and long-term growth.
Are you measuring demand gen - or just marketing activity?
Turn content, campaigns, and attribution into a revenue system tied to engaged accounts, opportunity creation, velocity, and ARR.
Frequently Asked Questions
About the Author

Founder & CEO, Content RevOps
Stefan Kalpachev is the founder and CEO of Content RevOps, where he helps B2B SaaS companies transform their content into predictable pipeline. With a background in content marketing and revenue operations, Stefan has developed a unique methodology that bridges the gap between content creation and revenue generation.
Connect on LinkedIn