Marketing KPIs and Analytics for Asset Managers
Not sure which of your marketing numbers actually connect to pipeline? A content revenue audit shows you where the measurement gap is costing you.
Book a CallMost asset management firms do not have a data problem. They have Google Analytics, a CRM, email stats, and a marketing dashboard with more numbers on it than anyone reads. What they lack is the handful of marketing KPIs that actually connect what they publish to pipeline and to assets under management.
Part of Content Marketing for Asset Managers: The 2026 Playbook.
This guide gives asset managers a short, tiered set of marketing KPIs and analytics, from traffic at the top to influenced AUM at the bottom, plus the three measurement problems specific to asset management that generic KPI lists ignore. The goal is simple. Measure fewer things, each tied to money, and report them on one page. If you are still deciding where to start, read where to start with marketing for an asset management firm first, since it covers how to tell early on whether marketing is working.
What should an asset manager actually measure in marketing?
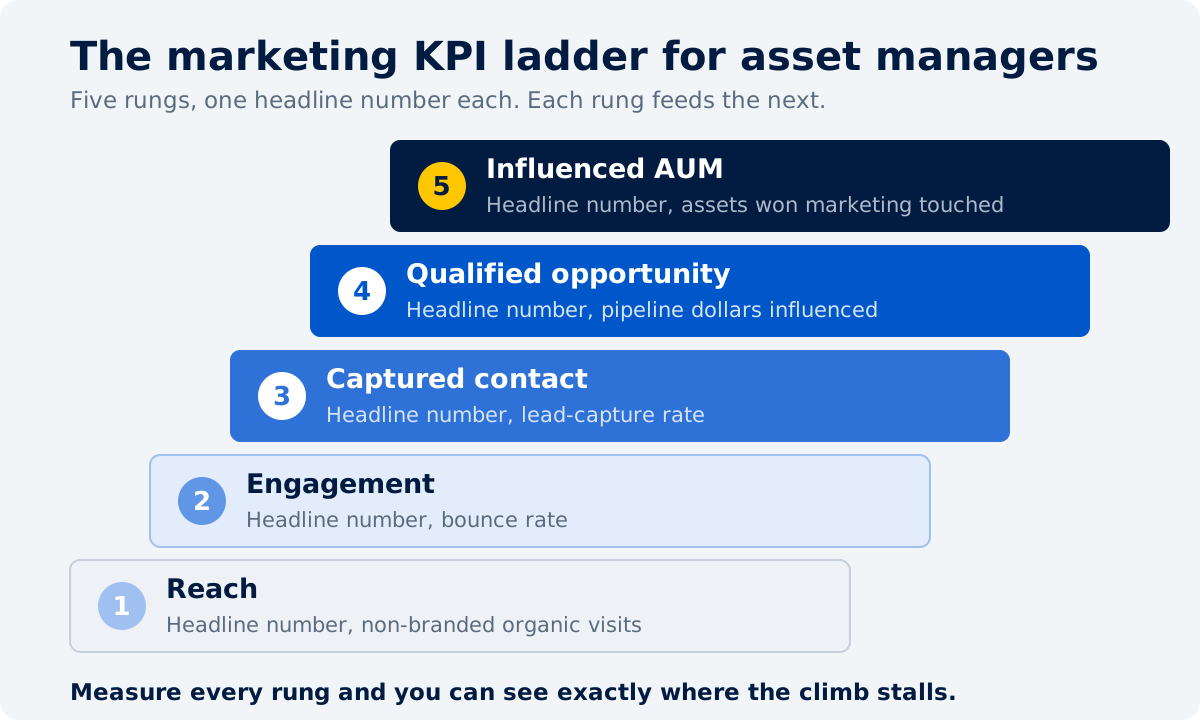
Measure the climb from a stranger reading a page to a dollar of assets won. Five rungs, one headline number each:
Reach. Non-branded organic visits, not raw traffic.
Engagement. How much a visit reads before it leaves.
Captured contact. The share of visitors who give you a name.
Qualified opportunity. Pipeline dollars a salesperson has valued.
Influenced AUM. Assets won where marketing touched the deal.
That is the whole framework. Everything else in a marketing dashboard is either a supporting detail under one of these rungs or a vanity metric you should stop reporting. The same logic holds well beyond asset management, as our breakdown of which demand generation metrics to track and which to ignore shows.
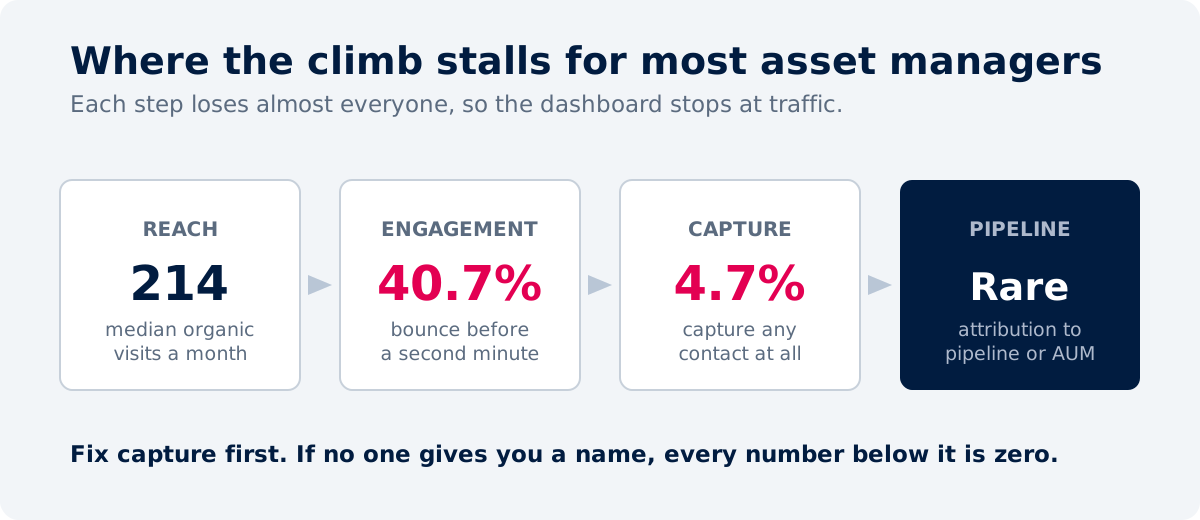
Most asset managers do not report this way for a structural reason. In our 2026 study of asset management content, attribution and automation are rare, so most firms cannot connect content to pipeline and end up measuring traffic they never act on. The median firm earns around 214 organic visits a month, which is presence without performance. A big number at the top of the funnel feels like progress. It tells you nothing about whether a mandate is any closer.
Why do asset managers track so much and learn so little?
Because analytics is everywhere and measurement discipline is rare. Every firm can see sessions, opens, and followers. Very few can tell you which of those turned into a conversation with a consultant or a committee.
This is not an asset-management failing alone. Nielsen's 2025 Annual Marketing Report, a survey of 1,400 marketers, found that 85% feel confident they can measure marketing ROI across channels, while only 32% actually do. Confidence tracks how easy a channel looks to measure, not whether the measurement means anything. The gap between feeling measured and being measured is where budgets get misallocated.
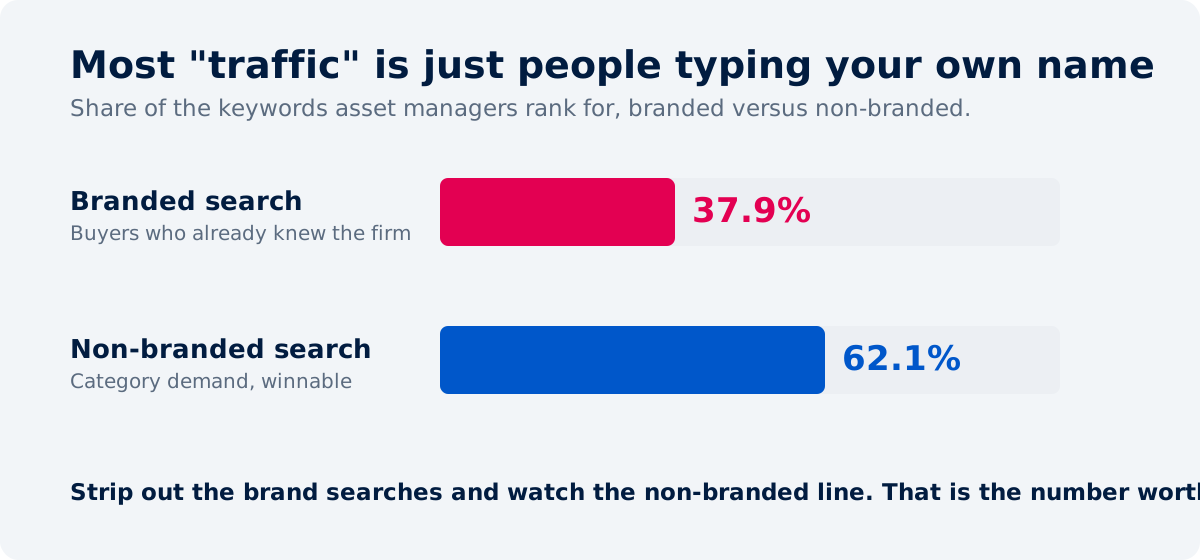
For asset managers, the trap is sharper, because the easiest number to grab is also the most misleading. In our study, 37.9% of the keywords that asset managers rank for are their own brand name. So a third of the traffic in the dashboard is just people who already knew the firm, typing it into Google. Counted as "marketing is working," it flatters a firm that is winning no new attention at all. The other 62.1% is non-branded, the category demand that is actually winnable on the merits, and that is the number worth watching. Our SEO playbook for asset managers covers how to grow that non-branded share.
A marketer in one r/marketing thread, asked how they are measured, put the distinction plainly. Not lead counts, they said. Pipeline means the dollar size of the opportunity, and for a lead to count as pipeline a salesperson has to have a conversation and assign a dollar value to it. That is the line most asset management dashboards never cross. They stop at the metrics that are easy to collect and never reach the ones a human had to qualify.
Only about 1 in 28 asset managers runs content as a system rather than as brochure pages or occasional news. If there is no system moving a reader toward a decision, there is nothing downstream to measure, so the dashboard fills up with what is left: traffic, opens, and reach.
What is the marketing KPI ladder for asset managers?
Think of your marketing KPIs as a ladder, not a list. Each rung measures one thing, and each rung feeds the next. A reader has to be reached before they engage, engage before they give you a name, give you a name before they become an opportunity, and become an opportunity before any assets are won. When you measure every rung, you can see exactly where the climb stalls.
This is the same logic we use when we design a funnel before making any content: name how a reader is meant to move from attention to a qualified conversation, then measure the movement. The funnel is the operating logic, not a reporting add-on, and our walkthrough of how the demand generation funnel works by the numbers shows what each stage typically converts. Here are the five rungs, with the one number to watch on each.
Rung 1, how many of the right people find you?
The headline number: non-branded organic visits. Measure how many people find you through the questions your buyers actually search, not how many sessions the site logged and not how many already knew your name.
Raw traffic is the classic vanity metric for an asset manager, because so much of it is branded. Strip the brand searches out and watch the non-branded line, the one that shows the category starting to find you. The median asset manager earns about 214 organic visits a month, so even small, real gains in non-branded reach are meaningful and worth isolating.
One supporting signal belongs here too. AI answers currently concentrate on five giants, Vanguard, BlackRock, Fidelity, State Street, and J.P. Morgan Asset Management, and the race below them is wide open, so whether your firm gets named in AI answers for your category is worth tracking as part of reach. We explain why most firms miss out in why asset managers don't show up in AI search.
Rung 2, how much does a visit read before it leaves?
The headline number: bounce rate. Bounce rate is the single figure to watch; return visits and pages per session are supporting detail.
Reach without engagement is a billboard nobody slows down for. In our study, the median bounce rate is 40.7%, and the reason is usually weak relevance and no next step. A visitor lands, finds a brochure paragraph, and leaves. Engagement tells you whether the content earned a second minute of a buyer's attention, which is the precondition for everything below it.
Rung 3, what share of visitors give you a name?
The headline number: lead-capture rate. Gated-asset downloads and newsletter signups are the supporting detail.
This is the first rung that proves intent, and it is the one most asset managers cannot report, because they never capture anything. In our study, only 4.7% of asset managers have any lead capture at all, fewer than 1 in 20, which means email and nurture have nothing to work with. The cause sits one step up: 96.5% of content ends with a weak or dead-end call to action, and only 13.5% place a relevant CTA in the flow of the content.
If you capture no names, every number below this rung is zero by default, and you are left reporting traffic. Fixing capture is less about more content and more about giving each page one primary purpose and a few sensible next steps, so a reader can move from a blog to a guide to a conversation. Our guide to marketing funnel optimization for asset managers works through those capture gaps stage by stage.
Rung 4, how many pipeline dollars has a salesperson valued?
The headline number: pipeline dollars influenced. The supporting detail is the count of sales-qualified opportunities and an opportunity-source field in the CRM.
This is where a captured name becomes money a human has valued, and it is where measurement breaks for most firms. A qualified opportunity is not a form fill. It is an opportunity a salesperson has looked at, had a conversation about, and attached a dollar figure to, exactly the distinction that marketer drew between a lead count and pipeline. Define tightly which roles and signals count as qualified, and record where each opportunity came from, so marketing can be credited when it did the work.
When we run a gated-report campaign for a client, we treat the download as the start of the funnel, not the finish, and wire an automated nurture plus a fast first follow-up so a captured contact actually progresses toward a call. The point for measurement is that the progression is trackable, so you can report pipeline influenced rather than downloads collected.
Rung 5, how much AUM did marketing touch?
The headline number: marketing-influenced AUM, the dollars of assets won on deals marketing touched. Win rate on influenced deals, cost per acquired dollar of AUM, and retention or cross-sell on nurtured relationships are the supporting detail.
This is the real scoreboard for an asset manager, and almost nobody climbs to it, because attribution is rare. There is no published industry benchmark for marketing-influenced AUM, so do not expect to compare yourself to a number. Build your own: tag the opportunities in Rung 4 that convert to funded mandates, sum the assets, and track them over time. When you can say that marketing touched a defined share of new AUM, the conversation about budget stops being about traffic and starts being about assets.
Why does a 30-day ROI number misread an asset manager's marketing?
Because an asset management mandate is not a 30-day purchase. Measuring marketing ROI over a quarter tells you almost nothing about a sale that takes a year to close.
Institutional manager selection typically spans six to eighteen months of due diligence, site visits, and reference calls, and it runs as a fiduciary governance workflow, not a sales cycle. Investment committees meet on quarterly calendars, so a decision that misses one meeting waits three months for the next. Our guide to marketing to institutional clients covers how that committee buys. A marketing ROI ratio measured over 30 days cannot see any of that. As the financial-services agency Vested puts it, a 5:1 ratio measured over a 30-day window will understate a product still nine months from converting. The math holds, but the window is too short.
This is also why you should be careful with the "good marketing ROI" numbers that circulate. The popular rule that a 5:1 return is good and 10:1 is outstanding has no research behind it. Trace it and every reference leads to one agency blog quoting another, with no study or methodology underneath. The nearest thing to an origin is the "Marketing Golden Ratio" from Marketo's Jon Miller in 2013, whose own numbers were different again, above ten excellent, above seven good, above five positive. In other words there is no universal benchmark to hit. A good marketing ROI for an asset manager depends on the mandate cycle and the firm's margin, and it has to be measured over the cycle, not the quarter.
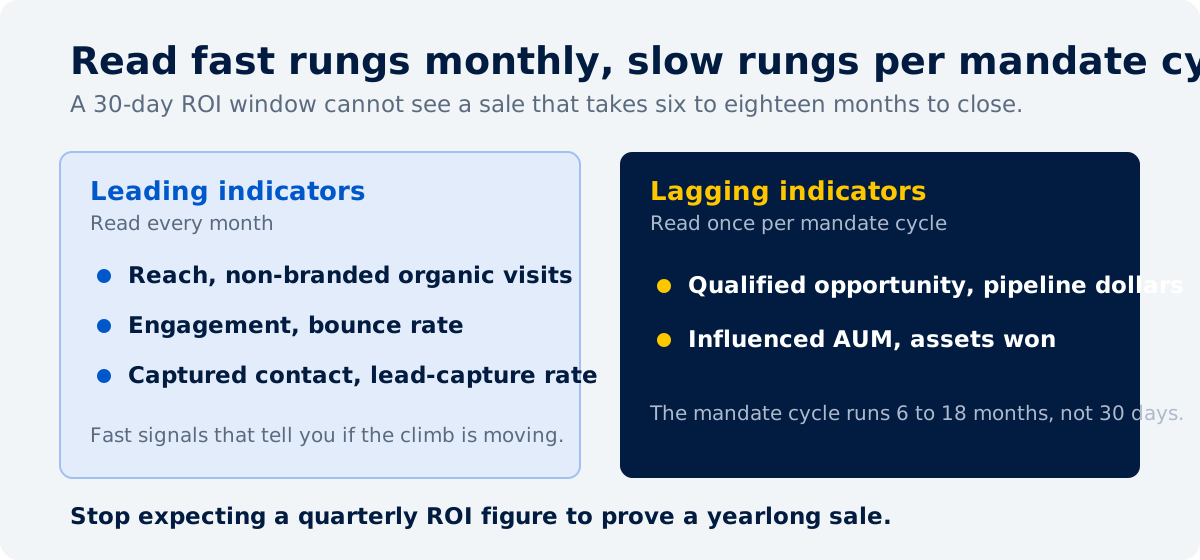
The practical fix is to split your KPIs by speed. The top three rungs, reach, engagement, and captured contact, are leading indicators you can read every month. The bottom two, qualified opportunity and influenced AUM, are lagging indicators you read across the mandate cycle. Judge the fast rungs monthly and the slow rungs per cycle, and stop expecting a quarterly ROI figure to prove a yearlong sale.
How do you measure a marketing buyer who never clicks?
Ask them. For asset managers, the most important buyers are influenced in places your analytics cannot see, so self-reported attribution often beats click tracking.
The asset management buyer is frequently a consultant, an investment committee, or an advisor who reads a PDF, forms a view, and recommends you in a meeting, generating no trackable click. Last-click and web-analytics attribution structurally undercount that path. Refine Labs ran a 12-month test comparing software attribution with self-reported attribution, asking buyers in their own words how they first heard of the firm. For Refine Labs' own business, self-reported attribution traced 98% of closed-won revenue to "dark social," the communities, podcasts, and word of mouth that tracking software was blind to. Those numbers are their result, not an asset-management benchmark, but the mechanism is exactly the asset manager's problem: software sees where someone first clicks, not where they first heard of you.
So measure both. Keep your click-based analytics for the demand you capture, and add self-reported attribution for the demand you create:
An unaided "how did you hear about us" field on every key form and at the point of sale, an open text box with no dropdown, so the buyer tells you in their own words.
An opportunity-source field in the CRM, filled by the salesperson from the conversation, not inferred from a cookie.
Assisted and multi-touch views that credit the content a buyer consumed before a human ever logged a touch.
None of this is perfect, and it does not need to be. It just needs to stop crediting the last click for a decision that was made in a committee room months earlier. This is the wiring we set up when we help firms see which page started the deal.
What does compliance let an asset manager measure and report?
It lets you measure marketing outcomes freely, and it limits how you may present investment performance. Keep the two separate and you stay clear.
The marketing KPIs on the ladder, reach, engagement, captured contacts, pipeline, and influenced AUM, are marketing outcomes, and nothing in the rules stops you measuring or reporting them internally. The constraint is on performance. Under the SEC marketing rule, 206(4)-1, a marketing communication is an advertisement, and if you show gross performance you must also show net performance with equal prominence, with substantiation behind any claim. Testimonials are allowed with disclosure.
There is a reporting discipline that follows from FINRA Rule 2210 as well. What you publish is a regulated communication that needs principal review and records you can produce on request. So "measure it and keep the record" is not a nice-to-have, it is the rule. The upside is that the recordkeeping you already owe doubles as the measurement trail your ladder needs. Our guide to compliance-friendly marketing for asset managers covers the publishing side in more depth.
How should an asset manager report marketing KPIs?
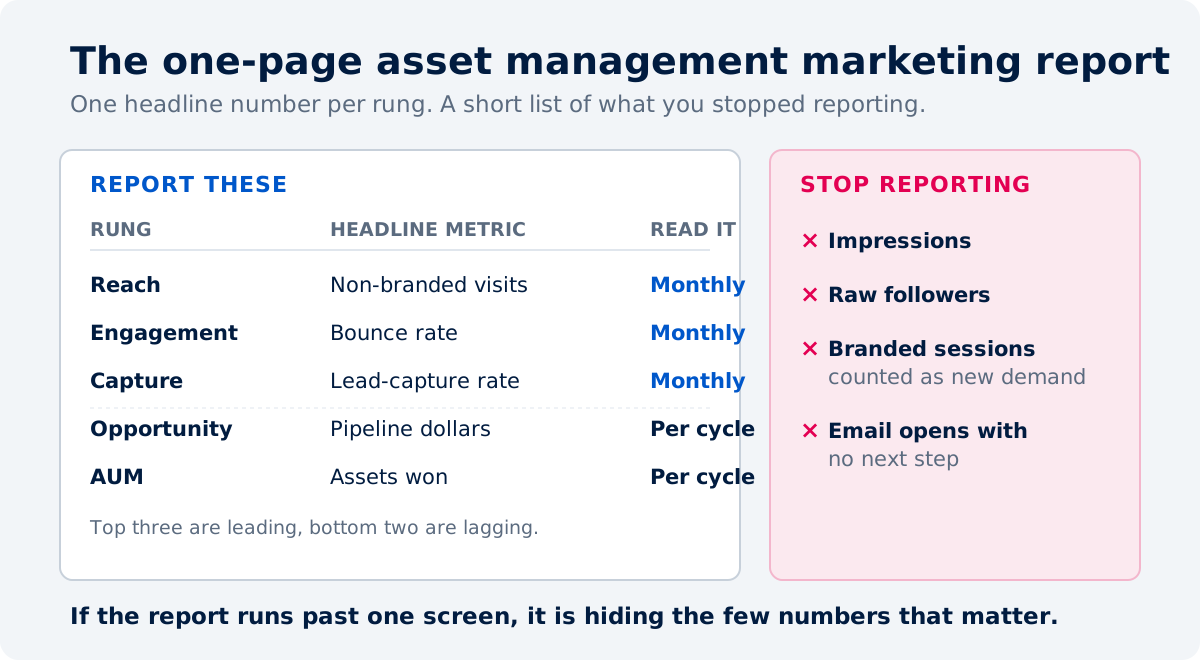
On one page, with a small set of pipeline-linked metrics and a short list of things you have stopped reporting. If a marketing report takes more than a screen, it is hiding the few numbers that matter under the many that do not. Our guide to reporting on content marketing success and the way we report on progress to our own clients follow the same rule.
What belongs on the one-page report?
One headline number per rung, each with its trend, laid out as the climb:
Rung | Headline metric | Read it |
Reach | Non-branded organic visits | Monthly |
Engagement | Bounce rate | Monthly |
Captured contact | Lead-capture rate | Monthly |
Qualified opportunity | Pipeline dollars influenced | Per mandate cycle |
Influenced AUM | Assets won on marketing-touched deals | Per mandate cycle |
The top three are leading indicators you review monthly. The bottom two are lagging indicators you review once per mandate cycle. That split keeps a slow-converting business from being judged on a fast clock.
What should you stop reporting?
Cut the metrics that feel like progress and prove nothing:
Impressions and raw followers, which measure audience size, not intent.
Undifferentiated sessions, especially branded search counted as new demand.
Email opens and generic "engagement" with no next step attached.
Dropping these loses no information. It stops a big, flattering number from standing in for a small, honest one.
How do you turn each gap into money?
A KPI report earns its budget when it speaks in dollars, not adjectives. The way we think about this is to price every gap. A missing capture mechanism is not "a CTA issue," it is a number of contacts not captured, times a realistic lead-to-client rate, times the value of a client. Our benchmarking tool for asset managers does exactly this, scoring your content estate against the study and showing the assumptions on the page so you can argue with the inputs rather than dismiss the output. Use it as an outside yardstick for where you stand, then report your own five rungs against it each cycle.
For asset management marketers who already feel the ground shifting, this is why the ladder matters now. Content only earns its budget when it is wired to produce and prove pipeline, and the KPI ladder is how you prove it.
Want to see where your asset management firm's content and capture sit against the field?
Our content revenue audit benchmarks your firm, finds where the funnel leaks, and puts a number on the gap.
Frequently Asked Questions
About the Author

Founder & CEO, Content RevOps
Stefan Kalpachev is the founder and CEO of Content RevOps, where he helps B2B SaaS companies transform their content into predictable pipeline. With a background in content marketing and revenue operations, Stefan has developed a unique methodology that bridges the gap between content creation and revenue generation.
Connect on LinkedIn