Fintech Marketing Statistics 2026
See how your fintech compares. Score your content against other fintechs in 12 inputs with our fintech content benchmarking tool and get your top three fixes.
Book a CallOnly about 1 in 4 B2B fintech companies (25.5%) run content marketing as a system, according to The State of Content Marketing for Fintech 2026. The median fintech website ranks for about 110 keywords, about half of fintech sites show no clear next step for a visitor, and 91% of fintech marketing roles ask for cross-functional collaboration while 41% ask for compliance fluency. These are B2B fintech marketing statistics. They come from a universe of about 2,000 Crunchbase-listed fintechs, a 500-domain performance benchmark, and about 160 fintech marketing roles narrowed from roughly 1,000 postings. Every figure below links to the page that holds it.
What are the key fintech marketing statistics for 2026?
Here are the ten fintech marketing statistics that matter most in 2026, each one linked to the study page that owns it.
- 25.5% of B2B fintech companies run active, systematic content marketing, per our fintech content maturity study.
- 16% of the content that active fintech publishers produce targets the decision stage, per our fintech content execution study.
- About half of fintech websites show no clear next step for a visitor, per the fintech content maturity study.
- Fewer than 1 in 4 fintech websites publish case studies (24.5%), per the fintech content maturity study.
- 7 in 10 fintech websites (71.5%) signal no clear buyer, per the fintech content maturity study.
- About 110 is the number of keywords the median fintech website ranks for, per our fintech content performance study.
- 61% of the keywords fintech websites rank for are informational, per the fintech content performance study.
- About 3 in 5 established fintech brands are named in AI answers to high-intent discovery queries, per the fintech content performance study.
- 57% of active fintech content publishers cover compliance, and only 23% of them reach expert depth, per the fintech content execution study.
- 91%, 75%, and 41% of fintech marketing roles ask for cross-functional collaboration, growth and experimentation, and compliance fluency, per our fintech marketing hiring study.
To see where your own fintech lands against these medians, the Fintech Content Benchmark Tool scores your site in a few minutes. For the same picture across every vertical we studied, see the State of B2B Content Marketing 2026 cross-vertical report.
How many fintech companies do content marketing?
About 1 in 4 B2B fintech companies run content marketing as a system. The rest publish little or nothing.
Fintech content maturity split
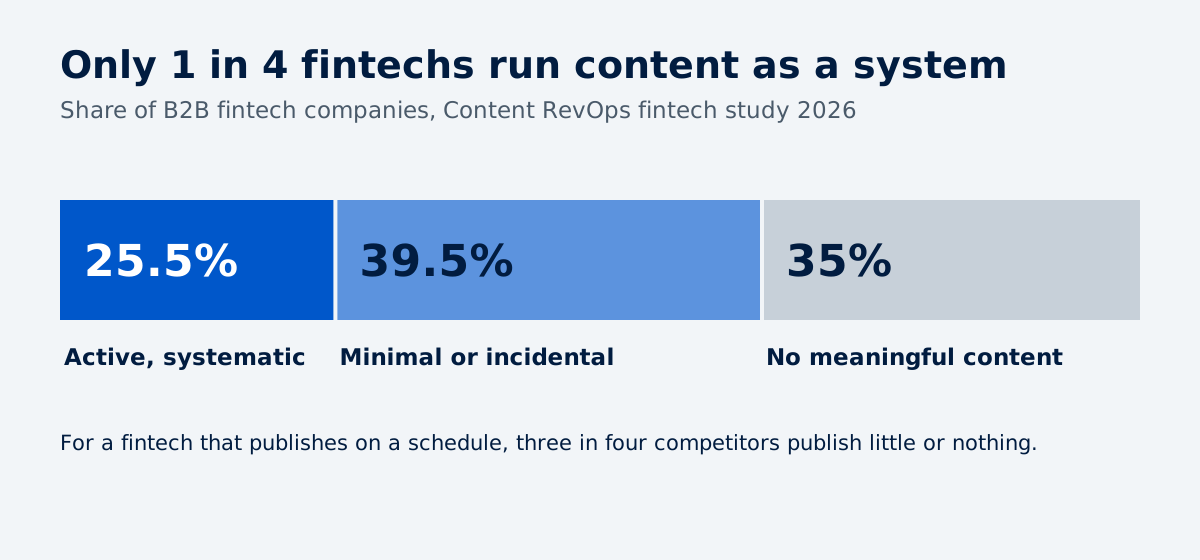
- 25.5% of fintech companies run active, systematic content marketing, according to our fintech content maturity study.
- 39.5% of fintech companies publish minimally or incidentally, per the same study.
- 35% of fintech companies show no meaningful sign of content marketing at all, per the same study.
The other three in four fintechs sit in those last two groups. For a fintech that publishes on a schedule, three in four of its competitors publish little or nothing. A structured content program is still a minority position in this market.
Fintech content maturity by company size and stage
Fintechs with 101-250 employees run active content about three times as often as fintechs with 11-50 employees (about 57% against about 18%), according to The State of Content Marketing for Fintech 2026.
About 1 in 7 seed-stage fintechs (13.6%) run active content marketing, per the same report.
Content marketing grows with company size in fintech. Small fintechs that start earlier face the thinnest field, and a minimum viable content plan is enough to stand out among them.
What content do B2B fintech companies publish?
B2B fintech companies publish whitepapers, blogs, and resource hubs most often, and most of what they publish targets early-stage buyers.
Content formats on fintech websites
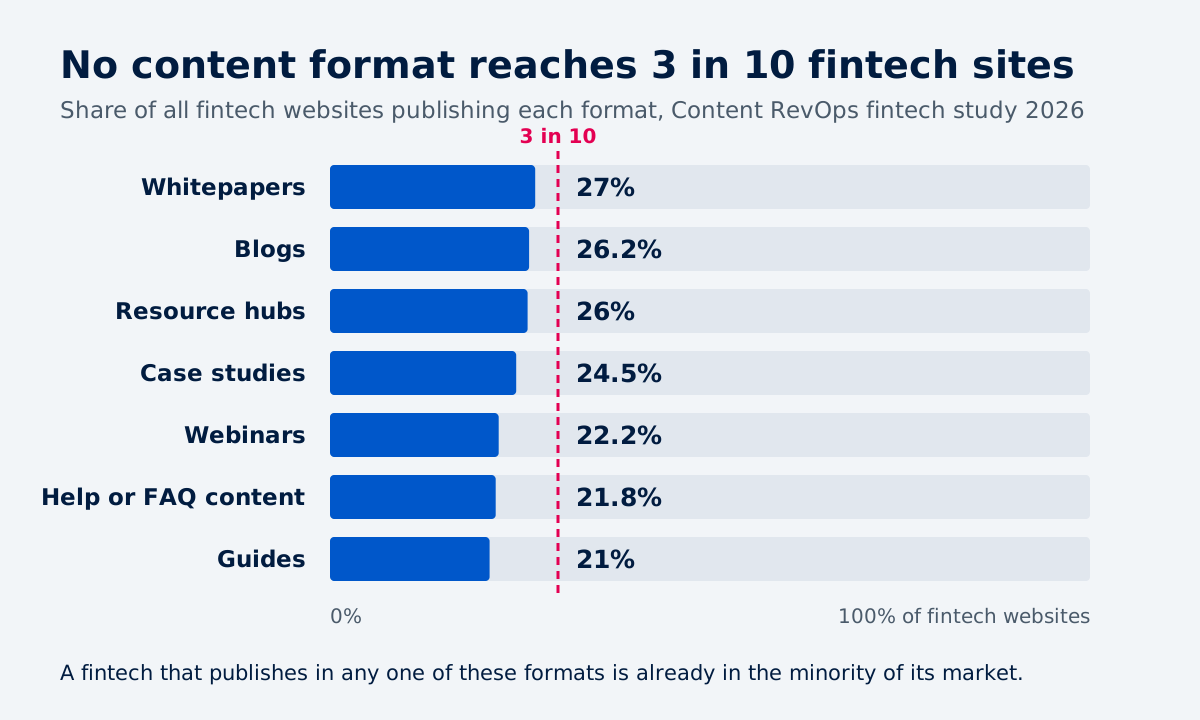
Whitepapers appear on 27% of fintech websites, the most common content format, according to our fintech content maturity study. The rest of the mix, as a share of all fintech websites:
- Whitepapers: 27%
- Blogs: 26.2%
- Resource hubs: 26%
- Case studies: 24.5%
- Webinars: 22.2%
- Help or FAQ content: 21.8%
- Guides: 21%
No single format reaches even 3 in 10 fintech sites. A fintech that publishes in any one of these formats is already in the minority of its market, and one that builds a flagship content product on top of it stands further apart.
Buyer-journey mix among active fintech publishers
Among active fintech content publishers, 43.9% of content targets awareness, 30.4% consideration, 16.1% the decision stage, and 10.6% post-purchase, according to our fintech content execution study.
More than 2 in 5 active fintech publishers have weak decision-stage coverage, per the execution study.
Fintech content does most of its work far from the buying decision. A buying committee comparing vendors finds little written for that moment, which is the gap mapping the funnel is meant to close.
How well do fintech websites convert visitors?
About half of fintech websites show no clear next step for a visitor, according to our fintech content maturity study.
Conversion elements on fintech websites
- A quote request appears on 46.2% of fintech websites and a demo request on 39.5%, per The State of Content Marketing for Fintech 2026.
- A newsletter signup appears on 28.7% of fintech websites, the rarest conversion element in the study, per the same report.
Demo and quote forms suit a buyer who is ready to talk. A fintech without a newsletter or another light-commitment option has no way to keep the earlier reader, and no list to nurture until that reader is ready. Our breakdown of the conversion layer covers what those options look like.
Calls to action inside fintech content
About 2 in 5 active fintech publishers (about 41%) place a call to action inside the article body, according to our fintech content execution study.
Fewer than 1 in 5 active fintech publishers (about 18%) match the call to action to the reader's funnel stage, per the execution study.
A reader halfway through a fintech article usually meets the same ask as a reader on the pricing page, or no ask at all. It is the same pattern behind blogs that get traffic but fail to generate demos.
How much proof and positioning do fintech companies publish?
Fintech companies publish technical documentation more than any other sales enablement asset, and most fintech websites never say who they are for.
Sales enablement assets on fintech websites
Technical documentation appears on 46% of fintech websites, according to The State of Content Marketing for Fintech 2026. The other sales enablement assets in the same report:
- ROI or business-case content: 34.2%
- Objection-handling content: 25.8%
Only about a third of fintech websites give a buyer an ROI case to take to their finance team. These are the supporting assets a buying committee asks for late in the deal.
Trust signals in fintech content
Among active fintech publishers, the same report finds:
- Author bylines: 63%
- Original data: about 35%
- Author bios or credentials: about 28%
- Visible update dates: about 8%
About 1 in 4 active fintech publishers rate excellent on trust signals overall, per the report.
A name on an article is common in fintech. The credentials and original data that let a risk-averse buyer trust it are much rarer, and they are what separates real thought leadership from a byline.
Positioning and buyer specificity
71.5% of fintech websites signal no clear buyer, according to our fintech content maturity study.
Only 9.5% of fintech websites name their buyer with high specificity, per the maturity study.
When a fintech site does not say who it serves, a bank's head of payments and a startup founder read the same generic page, and neither sees themselves in it. Choosing the right ICP and turning research into positioning come before any of the content.
How do fintech companies handle compliance content?
57% of active fintech content publishers cover compliance, and only 23% of them reach expert depth, according to our fintech content execution study.
Compliance content depth in fintech
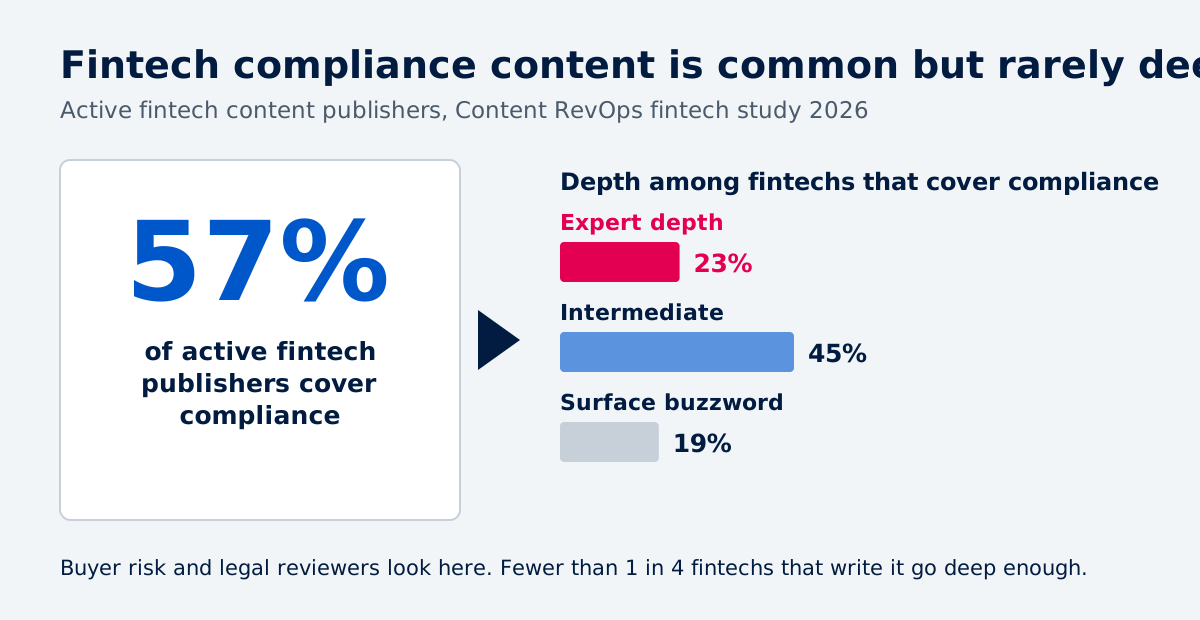
Among fintechs that cover compliance, 45% write at an intermediate, operational level and 19% use compliance as a surface-level buzzword, per The State of Content Marketing for Fintech 2026.
KYC and AML lead the compliance topics fintechs write about, alongside SOC 2, GDPR, and FINRA, per the same report.
Compliance content is where a fintech buyer's risk and legal reviewers look, and fewer than 1 in 4 fintechs that write about it go deep enough to help them. Regulated firms next door face the same test, as our piece on compliance marketing for asset managers shows. Hiring reflects the same need: 41% of fintech marketing roles ask for compliance fluency, covered in the skills section below.
What are typical fintech website traffic benchmarks?
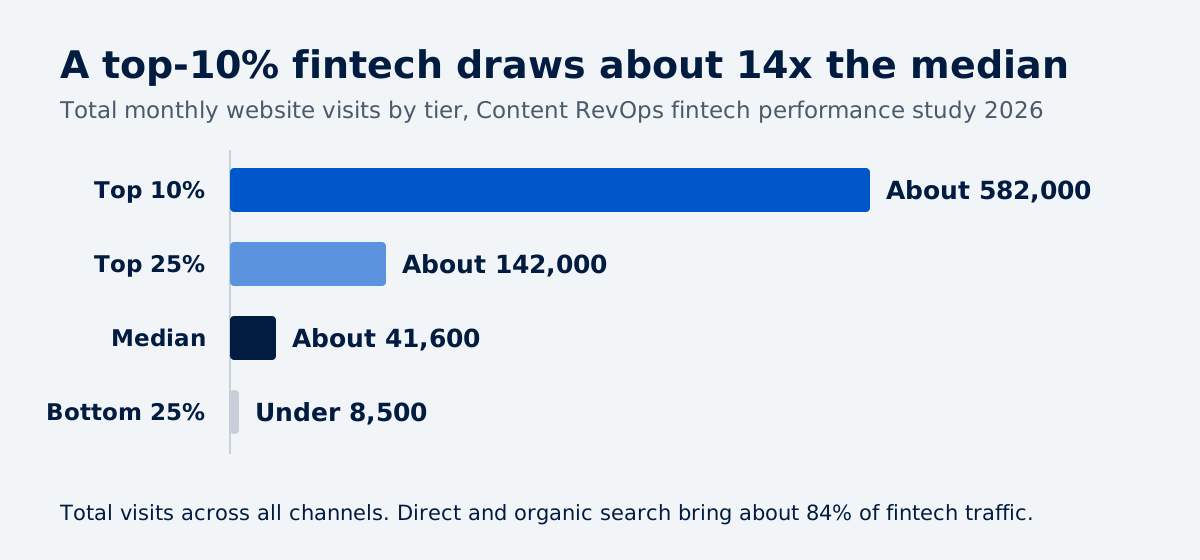
The median fintech website draws about 41,600 total monthly visits across all channels, according to our fintech content performance study.
Fintech website traffic by percentile
Fintech website tier | Total monthly visits |
Top 10% | about 582,000 |
Top 25% | about 142,000 |
Median | about 41,600 |
Bottom 25% | under 8,500 |
A top-10% fintech draws about 14 times the median fintech's traffic.
Fintech website traffic sources
The fintech traffic mix, per the performance study and The State of Content Marketing for Fintech 2026:
- Direct: 54.8%
- Organic search: 29.1%
- Display: 8.4%
- Social: 4.6%
- Paid search: 2%
- Referral: 1.1%
Direct and organic search together bring about 84% of fintech website traffic. Most fintech visitors either already know the brand or found it through search. Referral sits near 1%, which leaves distribution through partners and other publishers almost untouched.
What are typical fintech SEO benchmarks?
The median fintech website ranks for about 110 keywords and earns about 700 organic visits a month, according to our fintech content performance study.
Fintech SEO benchmarks by percentile
Fintech SEO metric | Median | Top 25% | Top 10% |
Ranked keywords | about 110 | about 1,500 | 8,000+ |
Organic visits per month | about 700 | 4,271 | 24,211 |
Estimated organic traffic value per month | about $4,900 | about $50,000 | $400,000+ |
Estimated organic traffic value is what the same traffic would cost in paid search, per the performance study. The median fintech already earns about $4,900 a month of search traffic it does not pay for.
Search intent behind fintech keywords
The keywords fintech websites rank for break down by intent as follows, per The State of Content Marketing for Fintech 2026:
- Informational: 60.8%
- Navigational: 17.7%
- Commercial: 15.8%
- Transactional: 5.6%
Commercial plus transactional keywords make up about 21% of fintech rankings, and transactional alone sits under 6%. About 94% of the keywords fintech websites rank for are non-branded, per the performance study.
Fintech sites mostly rank for learning queries. Few of them rank for the searches a buyer types when choosing a vendor. A topical keyword map built around buying questions is how that mix shifts.
How visible are fintech companies in AI answers?
About 3 in 5 established fintech brands are named in AI answers to high-intent discovery queries, according to our fintech content performance study.
AI Overviews in financial search
About 1 in 4 US financial-industry Google searches showed an AI Overview (25.79%), according to Conductor's 2026 AEO/GEO benchmarks for financials.
A fintech buyer researching on Google now meets an AI summary on a quarter of financial searches, before any ranked link. Our guide on optimizing content for AI Overviews covers how to write for that summary without losing the human reader.
AI-ready content on fintech blogs
Key-takeaway boxes and FAQ sections each appear on about 1 in 10 active fintech blogs, according to our fintech content execution study.
Tables of contents appear on 16% of active fintech blogs, per the execution study.
Nine in ten active fintech blogs publish without these answer blocks. Strong SEO pages carry part of the load, but AI search visibility asks for more.
What drives fintech visibility in AI answers
The State of Content Marketing for Fintech 2026 links fintech AI visibility to review-site coverage, product documentation, specific positioning, authoritative third-party mentions, and structured data.
Most of those drivers sit outside the blog. An AI engine builds its picture of a fintech from what review sites, documentation, and other publishers say about it, as well as from the fintech's own pages. That is why one brand gets cited while a better-known competitor gets ignored, and why a fintech can rank on Google and still be missing from ChatGPT. Knowing which prompts to track tells you whether any of it is moving.
A fintech example
Banking Crowded, a fintech and banking intelligence business we work with, now gets about 22% of its inbound traffic from AI and LLM referrals, and those leads convert at about 5x its baseline. When AI traffic does not convert, the cause is usually the page it lands on, not the channel.
How do fintech companies use paid media and marketing technology?
About 1 in 13 fintechs (about 8%) run detectable Google Ads, against about a third of active fintech content publishers, according to The State of Content Marketing for Fintech 2026.
Fintech paid and social media
- About 1 in 13 fintech LinkedIn advertisers use ads to promote content, per the same report.
- About 82% of active fintech content publishers keep an organic LinkedIn presence, per the report.
Fintechs that publish content are far more likely to also buy search ads. Very few put paid budget behind the content itself, one of the distribution channels most fintechs leave unused.
The fintech marketing technology stack
The median fintech website runs about 75 marketing technologies, according to The State of Content Marketing for Fintech 2026. The most common tools on fintech websites:
Tool | Share of fintech websites |
Google Tag Manager | 77% |
Google Analytics | 72% |
HubSpot | 34% |
LinkedIn Insight Tag | 29% |
Salesforce | 16% |
Analytics tags run on about three in four fintech websites. CRM tags such as HubSpot and Salesforce show up on far fewer, so most fintechs can count visits but cannot see which page started the deal.
What skills do fintech companies hire marketers for?
91% of fintech marketing roles ask for cross-functional collaboration, according to our fintech marketing hiring study of about 160 fintech marketing roles.
Skills named in fintech marketing roles
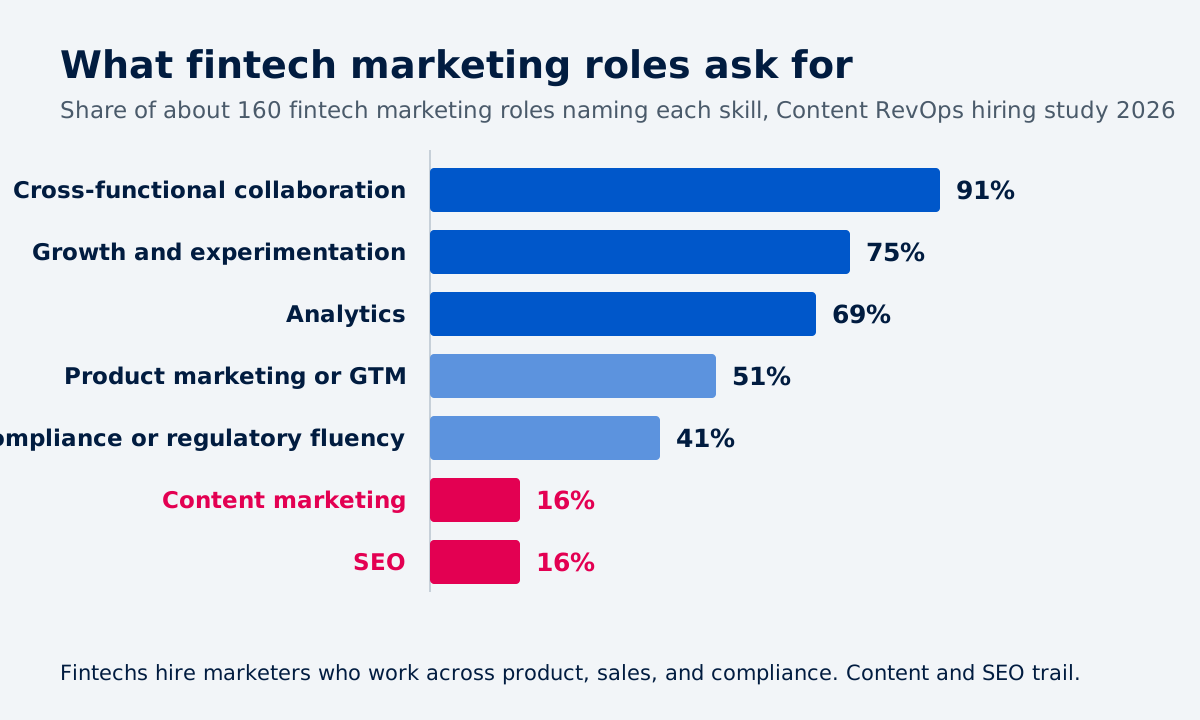
Across those roles, per the hiring study and The State of Content Marketing for Fintech 2026:
- Cross-functional collaboration: 91%
- Growth and experimentation: 75%
- Analytics: 69%
- Product marketing or go-to-market: 51%
- Compliance or regulatory fluency: 41%
- Content marketing: about 1 in 6 (16%)
- SEO: about 1 in 6 (16%)
Fintechs hire marketers who work across product, sales, and compliance. Content and SEO show up as named skills in only a small share of roles. Our study of 1,000 demand generation manager job postings finds a similar tilt toward cross-functional, pipeline-facing work.
Channels named in fintech marketing roles
Partnerships (44%) and events (40%) lead the channels named in fintech marketing roles, per the hiring study.
Fintech hiring managers look for marketers who can build relationships with partners and run rooms at industry events, alongside the digital channels.
AI in fintech marketing roles
About 3 in 5 fintech marketing roles reference AI, according to the hiring study. About 28% mention AI for content and about 30% AI for workflow.
Answer-engine optimisation already appears in a low single-digit share of fintech marketing roles, per the same study.
AI has become a standard line in fintech marketing job posts. Getting a fintech named in AI answers is only starting to show up as a skill employers ask for, even as AI reshapes the top of the funnel.
What do fintech marketers earn?
The median advertised salary for fintech marketing roles is about $143,000, according to our fintech marketing hiring study.
Leadership-titled fintech marketing roles advertise a median of about $220,000, per the hiring study. For comparison across industries, see what 1,000 demand generation director jobs reveal about leadership pay.
Fintech marketing salary by employer size
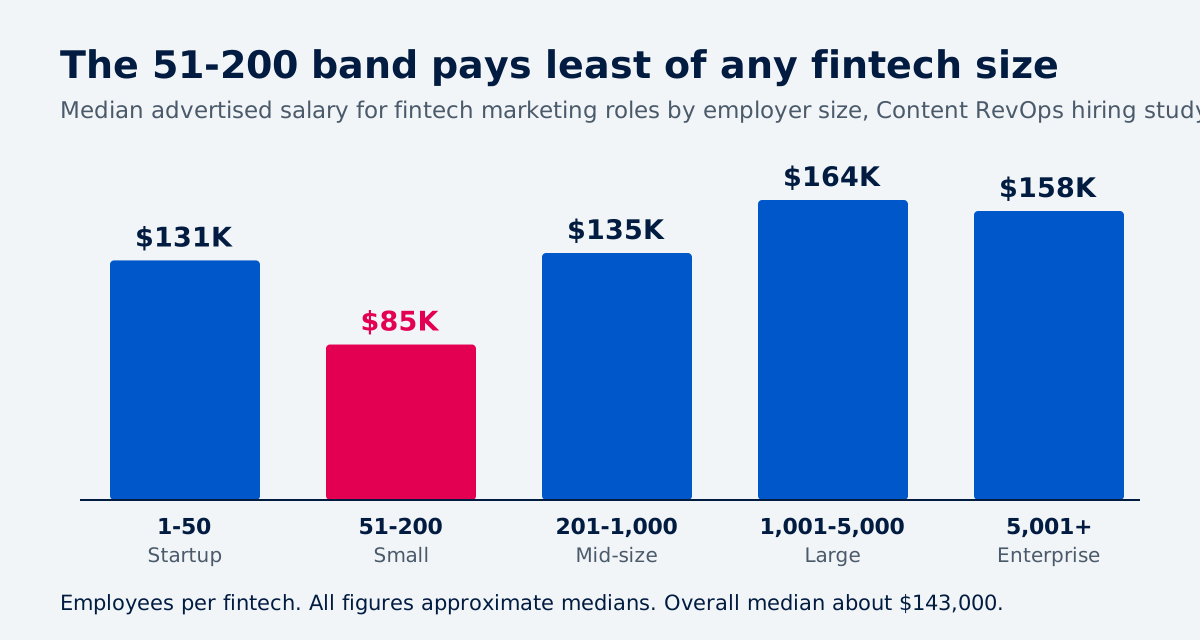
Fintech employer size | Median advertised salary |
Startup, 1-50 employees | about $131,000 |
Small, 51-200 employees | about $85,000 |
Mid-size, 201-1,000 employees | about $135,000 |
Large, 1,001-5,000 employees | about $164,000 |
Enterprise, 5,001+ employees | about $158,000 |
Source: The State of Content Marketing for Fintech 2026.
The 51-200 band pays least of any fintech employer size.
What do other fintech marketing studies show?
Four outside studies add spend, acquisition cost, AI adoption, and buyer behaviour to the fintech picture.
Fintech marketing spend
Publicly listed fintechs spend about 3x more on sales and marketing than traditional financial firms, according to Sufi et al.'s "FinTech and Customer Capital" research at the Becker Friedman Institute, University of Chicago.
Listed fintechs that have existed for 30-40 years still spend about 6x more than traditional financial firms of the same age, per the same research.
Heavy sales and marketing spend stays part of the fintech model long after the startup years.
Fintech customer acquisition cost
B2B customer acquisition cost in fintech averages about $1,450 for SMB customers, $4,903 for mid-market customers, and $14,772 for enterprise customers, according to First Page Sage's 2026 fintech CAC benchmarks.
In First Page Sage's figures, an enterprise fintech customer costs about ten times an SMB customer. That gap is why which metrics you track matters more than raw lead volume.
AI use in fintech marketing teams
75% of financial services and fintech marketers use AI regularly, and 44% have no formal AI strategy, according to the Accuracast and Fin.Tech Marketing Community 2026 report.
Three in four of these marketers use AI, and close to half do so without a formal strategy.
How B2B fintech buyers choose vendors
The Hoffman Agency's From promise to proof study, a survey of tech buyers at banks and fintechs, reports:
- Finance takes part in 67% of purchases, IT in 65%, and compliance in 24%.
- 56% of buyers report a 6-12 month sales cycle.
- 25% have ruled out a vendor for lacking relevant case studies.
A quarter of these buyers have dropped a vendor over missing case studies, and fewer than 1 in 4 fintech websites publish them. Our roundup of B2B demand generation case studies shows how that proof gets built into the buying journey.
How does your fintech compare to these benchmarks?
Put your own fintech's keyword count, monthly visits, and call-to-action setup beside the medians on this page.
The Fintech Content Benchmark Tool does it for you. You enter 12 numbers about your site and content, and it returns a score out of 100 with the top fixes for your fintech.
For the full dataset, read The State of Content Marketing for Fintech 2026. Fintech sits close to asset management, and the State of Content Marketing for Asset Managers 2026 offers a useful neighbouring benchmark. To see how we work with fintech and financial services teams, visit our financial services page.
Turn these benchmarks into your own numbers
We build fintech content systems and the go-to-market wiring around them, so what you publish turns into conversations, accounts, and referrals. Start with the fintech content benchmarking tool.
Frequently Asked Questions
About the Author

Founder & CEO, Content RevOps
Stefan Kalpachev is the founder and CEO of Content RevOps, where he helps B2B SaaS companies transform their content into predictable pipeline. With a background in content marketing and revenue operations, Stefan has developed a unique methodology that bridges the gap between content creation and revenue generation.
Connect on LinkedIn