Construction Marketing Statistics 2026
See how much of your construction content is actually built to win work. Start with a content revenue audit.
Book a CallConstruction marketing statistics in 2026 describe an industry rich in expertise but thin on demand. Most construction firms have a website and some content, yet only about one in three run content as a system, the median firm draws roughly 155 organic visits a month, and more than a quarter get no organic search traffic at all. Construction brands show up in only about 2.5% of AI answers. Meanwhile most firms keep paying for traffic, with paid-search adoption near 73%. The statistics below pull together our 2026 study of 2,000 construction company sites and the best third-party benchmarks, each figure sourced and linked so you can quote it directly.
Part of Content Marketing for Construction: The Complete 2026 Guide.
Construction industry statistics for 2026
Construction is one of the largest sectors of the US economy, which is the backdrop every construction marketing statistic sits against.
- $2.2 trillion. Total US construction spending in 2025, according to Construction Coverage's analysis of US Census data.
- 919,000+ construction establishments. The number of construction businesses operating in the US, per the Associated General Contractors of America.
- About 8 million people. Total construction industry employment, also per the AGC.
A large, high-value market makes the marketing gap that follows more striking, not less. The money and the buyers are there. Most firms just are not set up to win them online.
Construction content marketing maturity statistics
Most construction firms do not run marketing as a system, and this is the single most important number on the page. In our audit of 2,000 construction company sites, the industry splits almost evenly into thirds.
- 32.8% run active content marketing. They publish on a recurring schedule, organize it, and build visible paths to convert.
- 37.8% are minimal or inconsistent. The largest group publishes in fits and starts, a stale blog and a few case studies, with no real program behind it.
- 29.4% show no meaningful signs. Close to a third are digital brochures, a site with a product page, an about page, and a contact form.
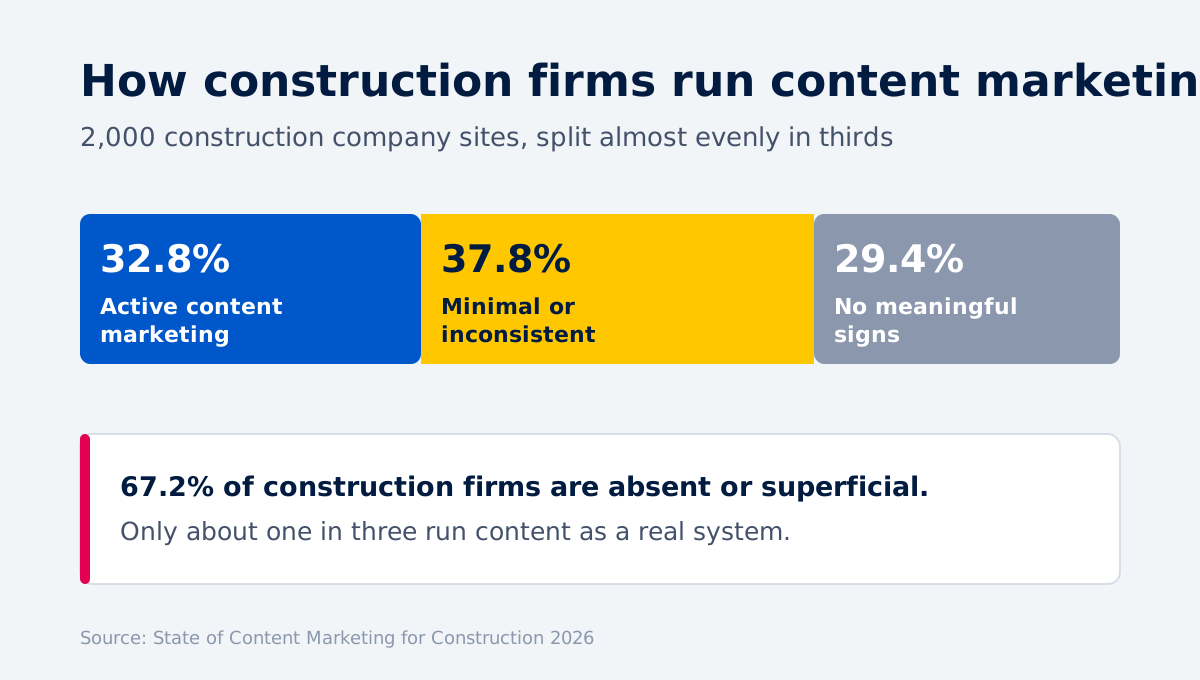
Put the bottom two groups together and 67.2% of construction firms are either absent or superficial in their content marketing. Only about one in three run a real engine.
Maturity tracks size and growth
Whether a construction firm markets as a system rises with scale and momentum.
- 56.5% of firms with $500M to $1B in revenue run active content, the peak of the whole dataset.
- 13.8% of firms under $1M in revenue do, the floor.
- 39.1% of high-growth firms are active, against 30.9% of low-growth firms.
The firms pulling ahead are the ones treating content as a system. Building that system is part of how construction companies grow, not a luxury they buy after growing.
Construction marketing budget statistics
Construction marketing budgets still flow to rented channels, which is where the spend data starts. Most firms pay for traffic rather than earn it.
- About 73% of construction firms run Google Ads, per our 500-domain performance benchmark.
- ~$6.24. The average cost per click construction firms pay in paid search. Clicks are not cheap in this category.
- ~$11,000 to $63,000 a month. The estimated paid-search spend among firms that advertise, often more than an owned content asset would cost to build.
Where construction marketing budgets go
Among firms with a defined budget, spending splits across channels in roughly these bands.
Channel | Share of budget |
SEO and content | 25-35% |
Google Ads | 20-30% |
Traditional and events | 10-20% |
Social (organic) | 10-15% |
Marketing technology | 10-15% |
LinkedIn ads | 5-15% |
Video | 5-10% |
For context on returns, Siana Marketing's 2026 construction marketing ROI report puts the average marketing ROI for construction companies between 280% and 350%. Treat that as an agency benchmark rather than a guarantee; returns depend on the firm, the channel, and how well the spend is tracked.
Construction lead generation statistics
Construction firms lose leads at the conversion step, not just the traffic step, and our own data is where that shows up first. Publishing content is common. Turning a reader into a tracked lead is not.
- 33.4% of construction firms have a strong path from content to a commercial next step, per our audit. The rest is a polite dead end.
- 33% publish with a weak or nonexistent path, so the effort leaks straight back out.
- 46.8% use contextual calls to action inside their content. Most fall back on a generic "Contact us" in the footer.
- 33.3% have any lead capture at all, and where it exists it is usually a plain newsletter signup rather than a reason to convert.
Where construction leads come from
The third-party data on lead sources rounds out the picture.
- 53% of builders rely on referrals or word-of-mouth to generate new business, according to Buildertrend's 2026 construction data.
- 35.3% name generating quality leads as their single biggest sales challenge.
- 21 to 25 leads are needed to close one contract, and only about 30% of incoming leads become sales-qualified.
- 40.8% of builders have no documented sales process, and 58% close projects within one to three months.
Speed to lead is where deals leak
How fast a firm responds decides whether a lead survives. Harvard Business Review's audit of 2,241 US companies found an average first response time of 42 hours, and 23% of companies never responded at all. In a long, high-trust construction sale, a slow first reply undoes the marketing that earned the lead.
Construction content marketing statistics
Construction firms publish the easy formats and skip the ones that do commercial work. Our audit shows what actually sits on construction sites.
- 41.5% publish news or press releases, the most common format, mostly companies talking about themselves.
- 41.2% run a blog, though it is rarely mapped to a buyer journey.
- 40.5% publish technical documents, the industry's deepest asset, often doing no commercial work.
- 37.9% have case studies, the proof buyers ask for, usually parked away from the decision.
- 37.5% publish any pricing information.
- 18.5% run webinars, the least-used format in a market that rewards depth.
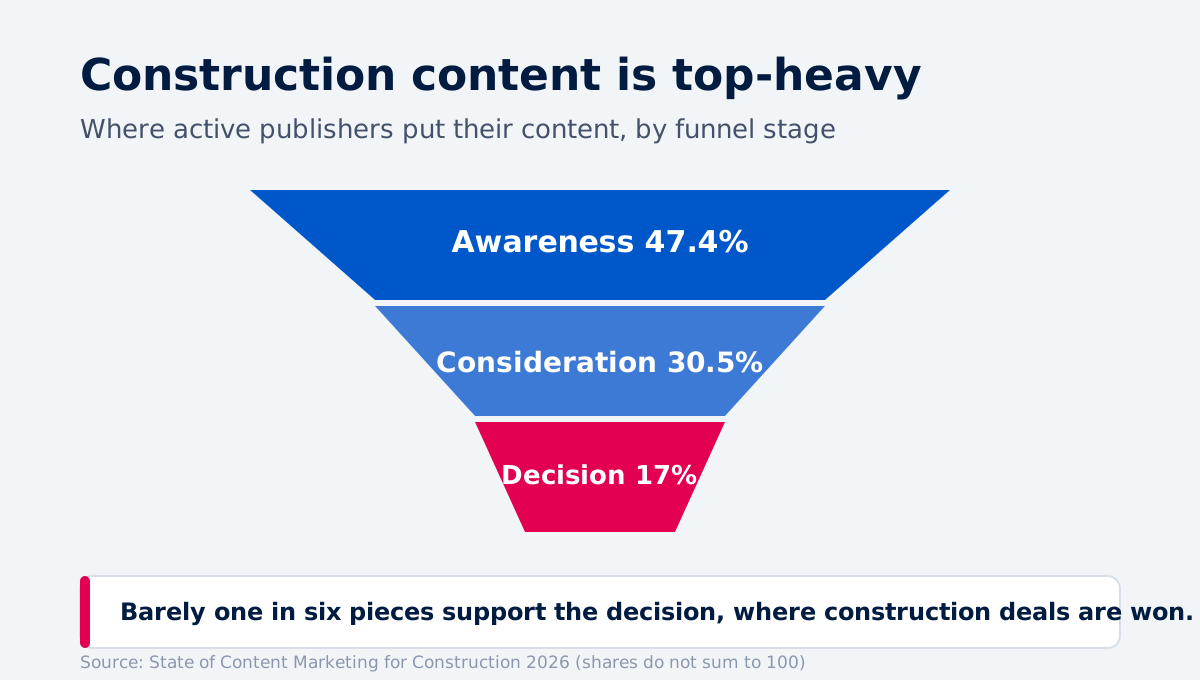
The funnel is top-heavy and decision-light
Content clusters where deals are not won. Among active publishers, the content mix skews to the top of the funnel at 47.4% awareness, thins to 30.5% consideration, and runs to just 17% decision. Barely one in six pieces support the moment a buyer chooses a firm.
The expertise is real, the authority signals are not
Construction firms know their work, but they rarely sign it or prove it. Among active publishers, 56.4% use named authors, 56.4% include expert quotes, and only 12.8% publish any original research or proprietary data. Original data is the most defensible authority a firm can build, and it is the industry's largest untapped reserve.
How construction firms distribute content
Construction firms lean on one channel and skip the ones they own. Among active publishers, 76.9% keep an active LinkedIn page, but only 43.6% run an email newsletter, the channel they actually control. On-site video appears on 46.2%, a YouTube channel on 41%, and social sharing buttons on 35.9%. Most content is published and then left to be found, not pushed through a planned sequence to an owned audience.
Construction SEO and organic traffic statistics
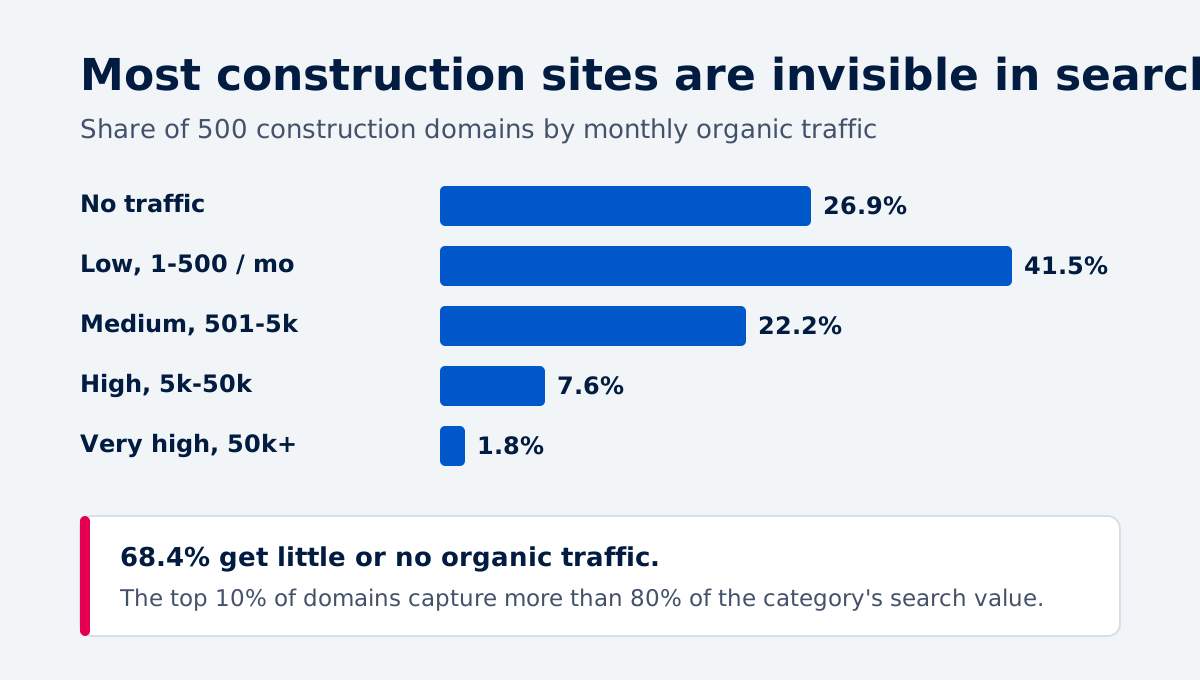
Most construction websites are demand-invisible in search, and the numbers are stark. Across our 500-domain performance benchmark, organic traffic concentrates at the very top.
Organic traffic band | Share of construction domains |
No traffic | 26.9% |
Low, 1-500 visits a month | 41.5% |
Medium, 501-5,000 | 22.2% |
High, 5,000-50,000 | 7.6% |
Very high, 50,000+ | 1.8% |
- ~155 visits a month. The median construction firm's organic traffic, which would not fill a webinar room.
- ~33 keywords. The number of terms the median firm ranks for.
- 80%+ of the category's search value goes to the top 10% of domains. Construction search is a winner-take-most market, so the firms that show up properly take almost all of it.
Construction search demand is non-branded
Most construction search demand is for the category, not for a specific company. 91.5% of search demand is non-branded, and only 8.5% is branded. That demand is winnable by whoever actually shows up for it, which today is a small minority.
Construction marketing and AI search statistics
Construction firms are nearly invisible in AI search while buyers increasingly ask AI first, and this is the freshest gap in the data. When AI engines answer construction questions, they lean on forums and reference sites, not construction firms.
- ~2.5%. The rate at which construction brands surface in AI answers, per our study, and rarely as the cited source.
- Reddit and Wikipedia lead the citations for construction queries, followed by sites like Indeed, HomeGuide, Angi, OSHA.gov, and Forbes. Company expertise is largely missing from the answer.
- 8.4% of construction marketing job postings mention AI at all, so the operating shift has barely reached the job spec. (Answer-engine optimization appears in almost no role; see the hiring statistics below.)
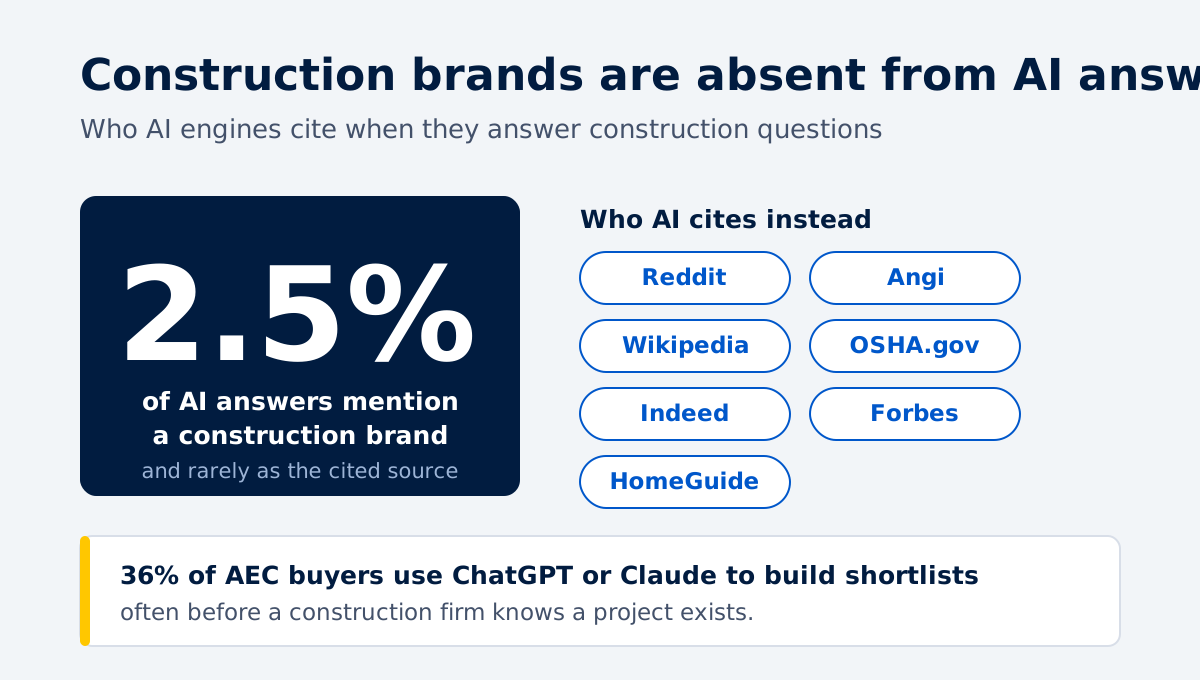
On the buyer side, the shift is already real. SMPS research shared by Steven McGill found that 36% of architecture, engineering, and construction buyers use ChatGPT or Claude to build shortlists before a firm knows a project exists. Builders are adopting the tools too: Buildertrend's 2026 data reports 66.7% of builders now use AI, with ChatGPT accounting for 91.3% of their AI chat-tool use, and marketing and client communications as the top use cases.
Construction marketing team and hiring statistics
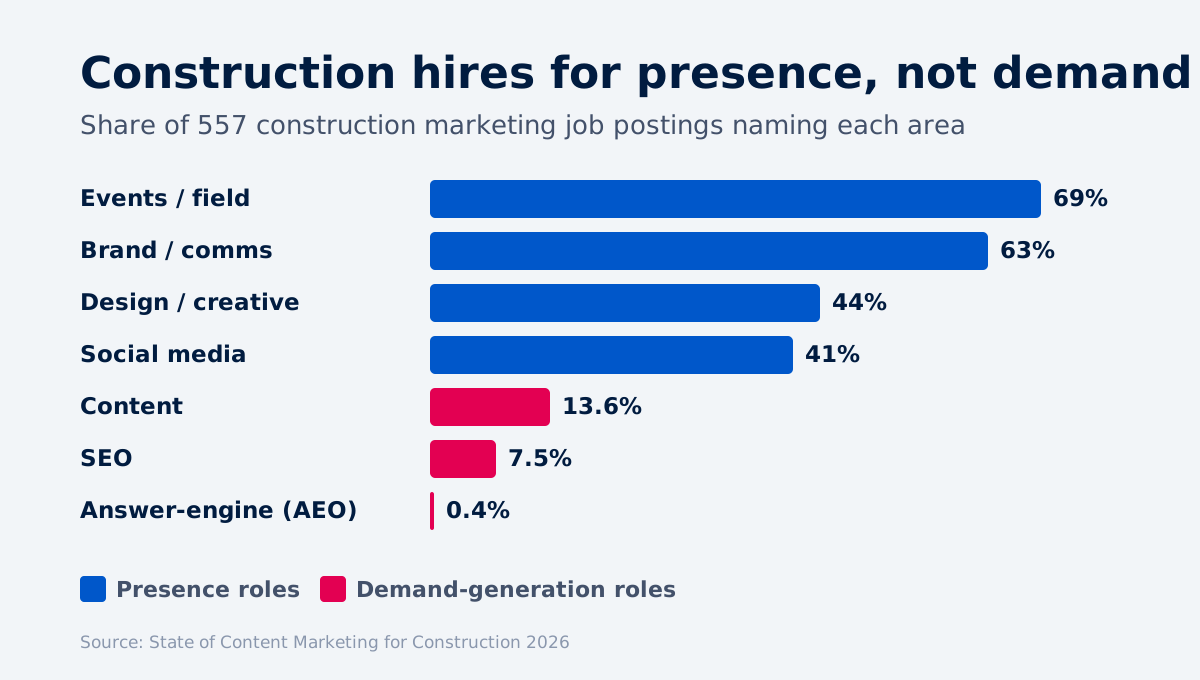
What construction firms hire for reveals what they actually value, and it confirms the rest of the data. Across 557 construction marketing job postings in our study, demand skews to presence, not demand generation.
- 69% of roles call for events or field marketing, the number-one hire.
- 63% call for brand or communications work, roles built to talk about the company.
- 44% design or creative, 41% social media, and 32% proposals or RFP and bid work, so one in three marketing roles touches the proposal.
- 16.5% name email, 13.6% name content, and just 7.5% require SEO, fewer than one in thirteen.
- 0.4% mention answer-engine optimization, the single clearest first-mover hire in the category.
Construction marketing salaries
Construction still prices marketing as a cost center. Blended pay across all roles sits at about $62,500, running from roughly $41,600 at entry level to about $93,300 for a manager and around $155,000 for a director and above.
The skills construction firms ask for
The most-requested competencies are general, not growth-specific: communication 88%, writing 59%, cross-functional work 55%, strategy 50%, and analytics 47%. The roles are built to produce and present, which is exactly why so little content connects to pipeline.
Want to know where your construction marketing leaks money?
Our content audit maps your site against the buying decision, finds the pages that should convert and do not, and puts a number on the gap.
Frequently Asked Questions
About the Author

Founder & CEO, Content RevOps
Stefan Kalpachev is the founder and CEO of Content RevOps, where he helps B2B SaaS companies transform their content into predictable pipeline. With a background in content marketing and revenue operations, Stefan has developed a unique methodology that bridges the gap between content creation and revenue generation.
Connect on LinkedIn