How life science companies justify and measure marketing spend
Fewer than 1 in 12 pharma and biotech sites run a detectable CRM, which is the real ceiling on what you can prove. Want to see where your own measurement stops?
Book a CallAsk how much a life science company should spend on marketing and you get a percentage of revenue. Ask how to prove the spend worked and you get a dashboard. Neither answer survives contact with a finance team, which is the gap our content marketing services exist to close.
Part of Content marketing for life sciences, the complete guide.
Both answers fail for the same reason, because they treat a capital allocation question and an evidence question as one problem with one answer.
There is a harder truth underneath. In this industry, marketing competes with R&D for the same dollar, and R&D wins almost every time.
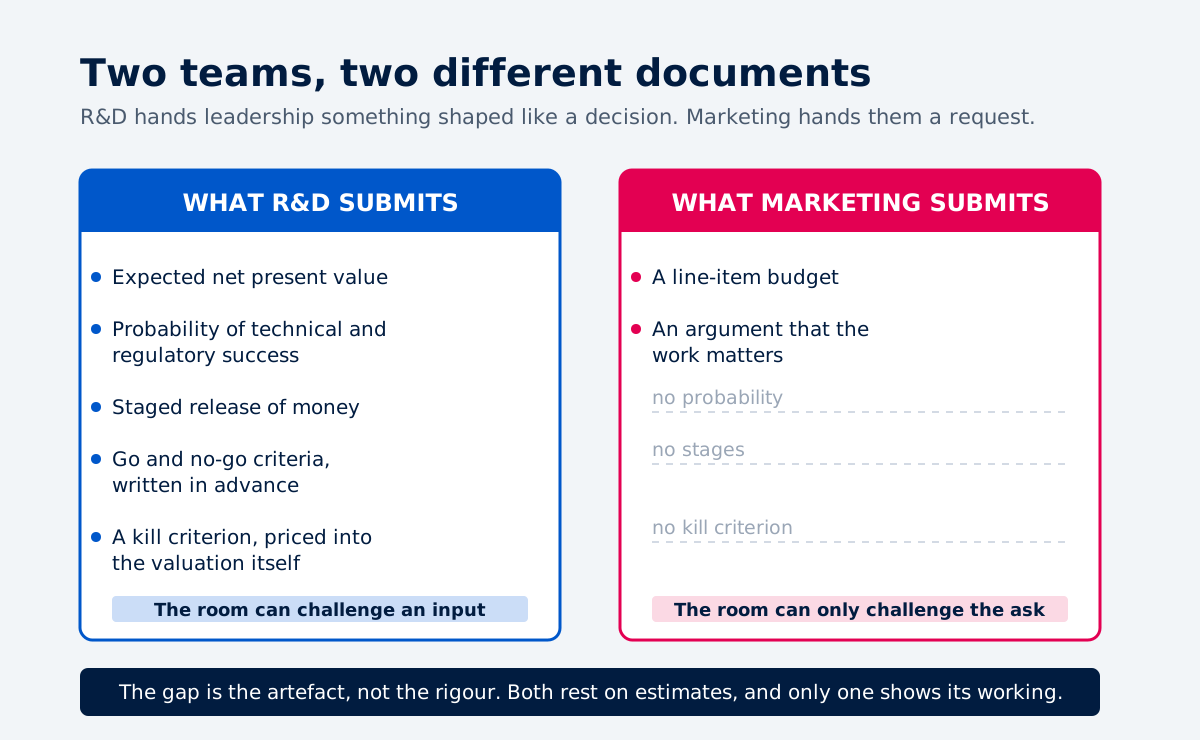
R&D wins because it submits a staged investment case carrying a probability of success, a decision gate, and a written criterion for killing the project. Marketing submits a line-item budget and an argument that the work matters. Those are different artefacts, and only one of them looks like the decisions your leadership team already knows how to make.
So this piece answers the two questions separately. Sizing a budget is a capital allocation problem, and the method changes completely when there is no revenue line to take a percentage of. Proving a budget is an evidence problem, and it starts with defining a cost base that almost nobody defines. If you are earlier than that, and still settling what the function is for, start with what life science marketing actually is and the five decisions that make a strategy.
How much do life science companies actually spend on marketing?
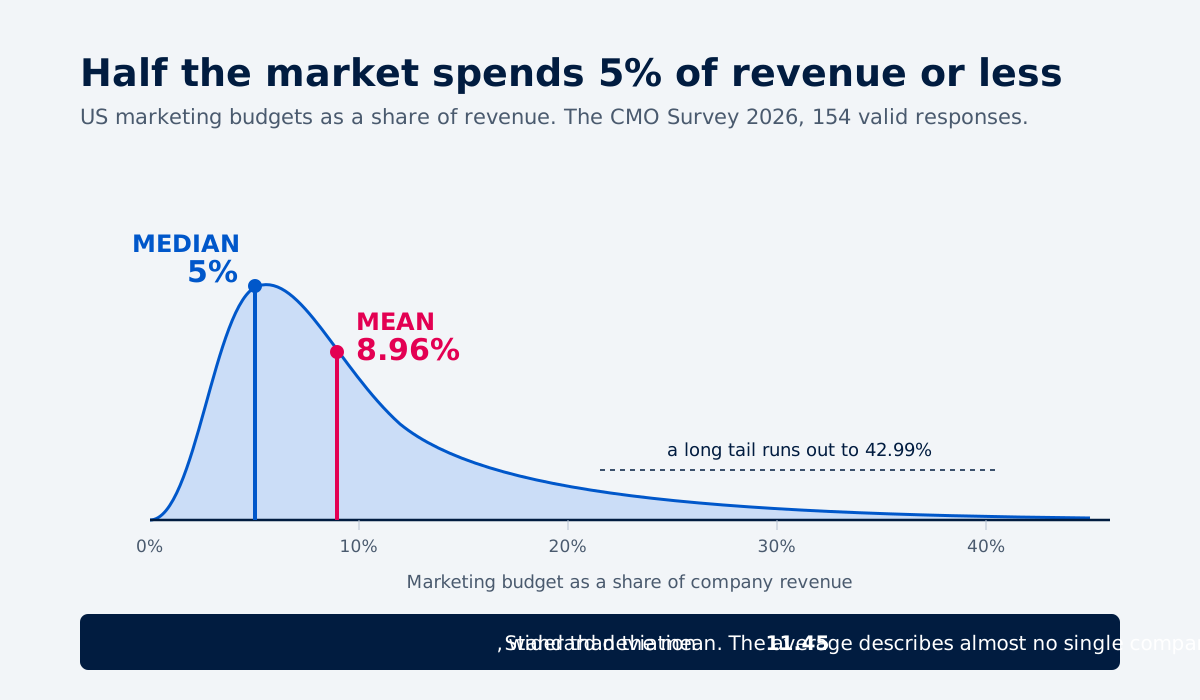
Across US companies of every kind, the median marketing budget is 5 percent of revenue and the mean is about 9 percent. Both numbers come from the same place, and the gap between them is the most useful thing in this section.
The distribution matters more than the average
The CMO Survey has run since 2008 out of Duke University's Fuqua School of Business, with Deloitte and the American Marketing Association, and it is explicitly non-commercial.
The 2026 edition went to 2,111 US marketing leaders. 308 responded, a 14.6 percent response rate, and 97 percent of them sit at VP level or above. It asks the exact question you are asking.
Here is the 2026 answer, on 154 valid responses:
Measure | Value |
Mean | 8.96% |
Median | 5% |
Standard deviation | 11.45 |
Minimum | 0% |
Maximum | 42.99% |
Read that table for thirty seconds and the familiar advice falls apart.
The 5 to 10 percent range sits roughly around the mean. The median company spends 5 percent, at the floor of that range, because the mean gets pulled upward by a long tail of companies spending into the twenties, thirties, and forties.
The standard deviation is 11.45 against a mean of 8.96. When the spread runs larger than the average, the average carries almost no information about any individual company, including yours.
So the honest version of the benchmark answer is that half the market spends 5 percent or less. If someone tells you that you should be at 8 or 10 percent, they are comparing you to a number most companies sit below. A percentage without a denominator behaves that way everywhere, which is why our life science marketing statistics state the group behind every figure.
The same survey notes that 8.96 percent is the lowest share of company revenues in several years, with total marketing spending up just 1.7 percent over the prior twelve months, the smallest increase since 2021. You are not imagining the squeeze.
Where the familiar benchmarks came from
The ranges circulating in life science marketing advice have provenance worth knowing about, since someone in your budget meeting may quote them at you.
- The often-repeated 7 to 13 percent range traces to a US Small Business Administration blog aimed at firms under $5 million in revenue, a cross-industry CMO spend survey from 2016 and 2017, and a general B2B aggregator. No life science source sits in that stack.
- A widely shared healthcare benchmark table carries fourteen numbered citations. Every in-text citation links to a single blog post on another agency's website.
- Several current 5 to 10 percent claims arrive with no source attached at all.
There is a more fundamental gap behind all three. No credible primary survey reports life science marketing spend as a share of revenue broken out by sub-vertical or company stage. That research does not exist, which is why the same secondhand ranges keep circulating, and why the numbers differ so much between biotech, medical devices, diagnostics, and CDMO and CRO businesses that get averaged together as one sector.
Even the best available source has a limit. In the CMO Survey's 2025 edition, pharma and biotech accounted for 19 of 281 respondents, so any pharma-specific percentage from it rests on roughly nineteen companies.
What our own modelling shows by revenue band
We model spend bands for pharmaceutical companies as part of our State of Content Marketing in Pharma research. They run higher than the cross-industry median at the small end, then converge toward it at scale.
Company revenue | Modelled annual marketing budget | As a share of revenue |
$1M to $10M | $500K to $1.2M | 10% to 15% |
$10M to $50M | $2.5M to $5.5M | 8% to 12% |
$100M to $500M | $18M to $35M | 6% to 10% |
The shape is the point. Our reading of it is that the fixed obligations of operating in a regulated, evidence-led market do not scale down, so a smaller company carries proportionally more of them. That is one of the structural constraints we work around across life sciences, and it shapes what a pharma marketing strategy can realistically carry at each stage.
Congress presence, regulatory review capacity, and payer-facing material all cost something close to a floor price regardless of company size. By the $100 million band, the revenue base has finally outgrown that floor.
The percentage matters far less than what it buys
Here is the argument for not spending long on the benchmark question at all.
In our analysis of organic performance, within every revenue band we measured, the top-performing companies generate roughly 100 times the organic traffic of their same-size peers.
Same revenue, same rough budget bracket, two orders of magnitude apart in what the money produced. That gap does not track company size, since the comparison happens inside each band. It tracks whether the money bought a connected system or bought more output. The same logic governs how a budget gets allocated once you have one, where the split between channels matters far less than whether the channels connect. Which of those channels life science companies actually fund, and which they leave empty, sits in digital marketing for life sciences.
An argument about whether you should sit at 7 percent or 9 percent is an argument about the least consequential variable in the room.
Why you cannot check what anyone else spends
If you have tried benchmarking against a public competitor and given up, the reason is structural.
Companies report advertising costs inside selling, general, and administrative expense. Under ASC 720-35, a company discloses its advertising accounting policy and the total charged to advertising expense, and that is all. Marketing as a whole has never been a required line item.
The newer standard tightens this only slightly. ASU 2024-03 now requires companies to disclose total selling expenses, but the FASB deliberately declined to define what "selling expenses" means.
Hold onto that. It returns later, and it answers a question that has nothing to do with benchmarking.
What do you size the budget against when there is no revenue line?
You size it against forecast launch-year revenue, not current revenue, and you release it against milestones rather than quarters.
This is the question a percentage of revenue cannot touch. A clinical-stage biotech has no revenue. A device company before clearance has no revenue. A diagnostics company before a coverage decision may have revenue that says nothing about the market it is entering.
Switching the denominator, with numbers behind it
The most useful evidence comes from an analysis by Syneos Health of emerging companies launching a first product, built from 10-K filings, annual reports, and analyst research.
Syneos sells commercial services, so treat this as a vendor-conducted study. It is assembled from audited public filings with the method stated, which puts it ahead of anything else available on the question.
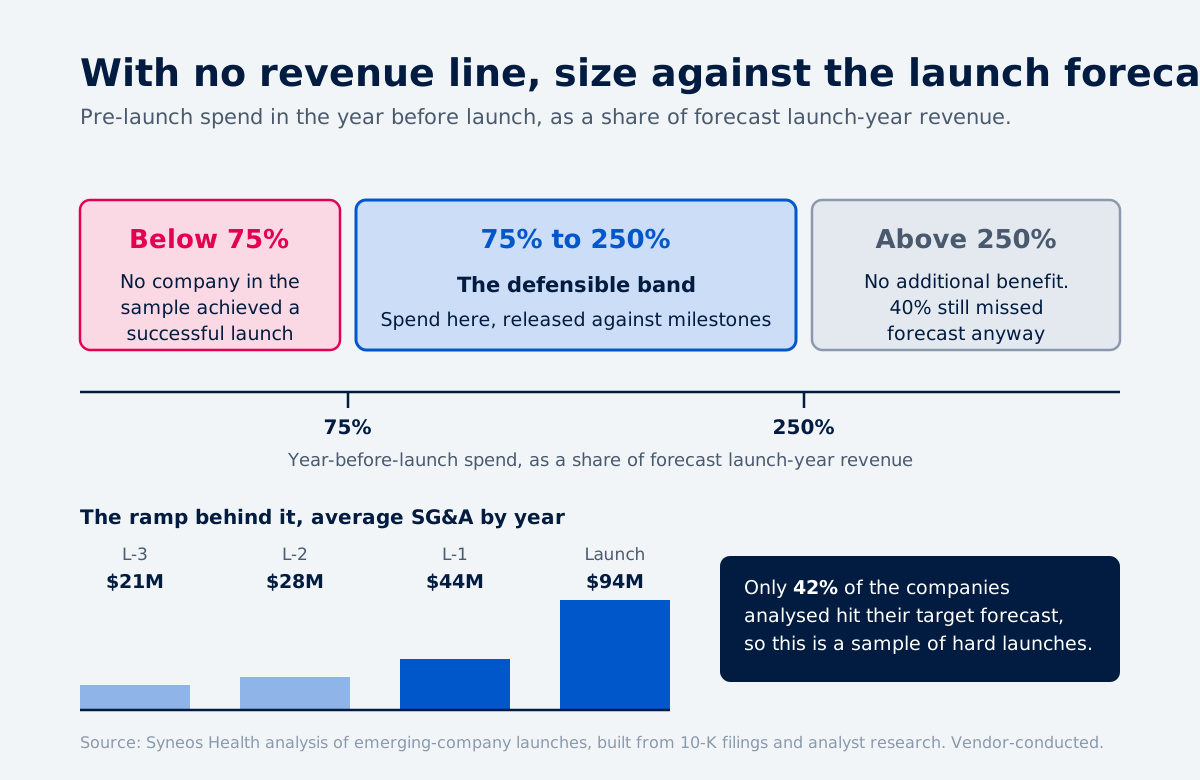
Companies in the sample spent an average of $187 million in SG&A across the three years before launch plus the launch year, with the practical floor around $130 million. The ramp matters more than the totals:
Year relative to launch | Average SG&A spend |
L-3 | $21M |
L-2 | $28M |
L-1 | $44M |
Launch year | $94M |
Only 42 percent of the companies analysed hit their target forecast, so this is a sample where most launches disappointed and the differences between them repay study.
The finding that should change how you build the number is this. No company that spent less than 75 percent of its launch-year forecast revenue during the year before launch achieved a successful launch. Not one.
There is a ceiling too, which is what makes the finding credible rather than a case for spending freely. Above 250 percent of launch-year forecast revenue in that same pre-launch year, extra spending showed no additional benefit, and 40 percent of companies in that range still missed forecast.
So the defensible band runs between roughly 75 percent and 250 percent of what you expect the product to earn in its first year.
Your industry already stage-gates commercial spend
The practice you need for the next section is one your company probably already follows.
In the survey work accompanying that same vendor analysis, 78 percent of biopharmaceutical executives said they had delayed launch spend because of a stage-gating strategy.
There is a genuinely surprising twist in the same data. Three years out from launch, 38 percent of biopharmaceutical executives expected to spend more than half of projected launch-year revenue, against 68 percent of the finance and advisory professionals asked the same question.
A thirty-point gap, and it runs opposite to the story marketers tell themselves. On this evidence, finance wanted more pre-launch commercial investment than the operators did.
That is worth sitting with if you have assumed finance is the obstacle.
The calendar you budget against is the wrong one
Life science spend is gated by events that ignore fiscal years. Data readouts, submission dates, clearance decisions, coverage determinations, congress calendars, and financing rounds set the real clock.
A budget defended quarter by quarter fails the moment a readout slips and the whole plan looks wrong. A budget released against milestones survives that, because the trigger moved rather than the logic. It is the same reason we set expectations against what results arrive and when before any work starts, rather than against a calendar quarter.
Why does R&D get its money and marketing gets questioned?
Because R&D hands leadership a document shaped like a decision, and marketing hands leadership a document shaped like a request.
First, though, the statistic that is probably coming across the table at you deserves a proper answer.
The marketing versus R&D statistic, and why it stays unresolved
Someone in your company believes pharma spends more on marketing than on research. Two credible analyses of that question reach answers roughly ten times apart.
The USC Schaeffer Center aggregated the income statements of every publicly listed US pharmaceutical firm from 1979 to 2018, across 4,923 firm-year observations. It found that R&D exceeded advertising every year from 1983 to 2018. In 2018 the industry spent $9 billion on advertising against $61.1 billion on R&D, so advertising ran at 15 percent of the research figure.
Gagnon and Lexchin, publishing in the peer-reviewed journal PLOS Medicine, built their estimate from the bottom up instead, counting detailing, free samples valued at retail, meetings, journal advertising, and direct-to-consumer advertising.
Their 2004 figure was $57.5 billion on promotion against $31.5 billion on R&D, which works out to 24.4 percent of the sales dollar going to promotion versus 13.4 percent to research.
Some of that gap is timing, since the two figures sit fourteen years apart and Schaeffer records advertising falling from 6.1 percent of sales in 1979 to 2.8 percent in 2018. Most of it is something else.
Schaeffer counted the advertising line in audited financial statements. Gagnon and Lexchin counted everything a company does to promote a product. Neither is wrong, and they answered different questions while appearing to answer the same one.
When your executive quotes the statistic, that is the useful reply. The industry cannot settle its most famous spending argument because nobody agreed what marketing spend includes, which is the same problem sitting inside your own budget at a smaller scale.
What R&D actually submits
Drug development decisions run on a documented method. The core measure is expected net present value, calculated as net present value multiplied by the probability of technical and regulatory success, with pharma discount rates typically landing between 8 and 12 percent.
That probability gets built by multiplying the success probability of each development phase, using documented attrition rates for the indication and stage.
Around it sits a governance process. Portfolio reviews run once or twice a year and weigh qualitative measures such as strategic fit alongside quantitative ones such as expected NPV, probability of launch, and risk-adjusted cost. Stage gates carry predefined go and no-go criteria.
The detail worth borrowing is that the augmented NPV model explicitly prices the option to terminate development if results disappoint. The kill criterion forms part of the valuation itself.
Why those numbers get funded
It would be easy to read that as an argument that science is rigorous and marketing is not. The literature says otherwise.
A framework paper in Clinical Pharmacology and Therapeutics observes that companies often rely on crude industry benchmarks for probability of success, benchmarks that may be "adjusted" by experts against undocumented criteria and that typically misalign with the definition of success driving commercial forecasts, producing overly optimistic expected NPV calculations.
So the probability at the centre of a drug development case can itself be an expert adjustment to a rough benchmark, presented as a number.
That does not discredit the method. It explains why the method works. The case gets funded because it arrives in the shape the decision process expects, showing its assumptions, its stages, and its exit conditions, so the people in the room can challenge an input rather than the ask.
Marketing rarely gives them anything to challenge.
The evidence that the case is not being built together
The 2026 CMO Survey asks marketing leaders how far the CFO acts as a business partner in building a business case for marketing spending, on a scale from 1 to 7.
The average across all companies is 4.5, and it has moved little since 2021, sitting at 4.3 in August of that year and 4.3 again in September 2022.
For readers here, the breakdown runs worse than the average suggests:
- B2B Product companies rate it 4.3. B2B Services companies also rate it 4.3.
- B2C Services companies rate it 4.9 and B2C Product companies 4.7.
- In the response distribution, 8.1 percent answered 1, meaning not at all, and 29.5 percent answered 3 or below on the 7-point scale.
The consequence shows up when results slip. When profits fall short of expectations, 53.1 percent of executives focus on cutting expenses rather than growing revenue, up from 46 percent a year earlier. When they cut, marketing gets cut 45.4 percent of the time, more often than any other expense category.
Marketing is the first thing cut, and the least jointly defended.
The reflex that makes it worse
The same survey found what marketing leaders do under that pressure, and it reads as a warning.
The predominant responses are a shift toward short-term impact over long-run gains, at 70.6 percent, and a return to established strategies, at 47.1 percent. Rather than investing in deeper customer understanding, most marketers reach for stronger performance tracking as their primary way to demonstrate value.
More dashboards is the documented reflex, and the CFO partnership rating has stayed flat throughout. Reporting is worth doing well, and how you report on content marketing success matters, but a better dashboard does not convert into a funded case on its own.
The same failure runs toward your buyers
There is an uncomfortable symmetry here, and it points at the fix.
In our pharma research, close to zero percent of sites publish an ROI calculator or a direct comparison page, and across the broader life sciences cut, ROI calculators appear on under 1 percent of sites.
Set that alongside everything above. The reader being asked by their own CFO to justify a number is, at the same time, declining to give their customer's finance committee the tool to justify buying. That absent decision layer is exactly what the conversion layer of a content product is built to supply.
The way we read that pattern, the same missing muscle shows up in both directions.
What marketing's version of the artefact contains
We run this discipline in our own audit work. Every gap we find becomes a number rather than an adjective, and the default assumptions get printed beside it.
That means the click-through curve, the visitor-to-lead rate, the lead-to-customer rate, and the average contract value all sit on the page. A prospect can then dispute an assumption instead of dismissing the conclusion, and showing the working is what makes a figure credible rather than promotional.
Applied to a budget request, the artefact carries six things:
- The commercial milestone the spend buys, named specifically.
- The expected value if it works, with the revenue assumption stated as an assumption.
- A probability, however rough, and the basis for it.
- The stages, releasing money at each one rather than committing it up front.
- The decision criteria at each stage, written before you start.
- The kill criterion, in writing, naming the point at which you would stop.
The sixth changes the conversation, and marketing almost never offers it. A team that specifies in advance how it would know it had failed reads as a team that has thought about the downside, which is exactly the signal a stage-gated R&D case sends.
What belongs in the ROI calculation before you run it?
You decide, then you write the definition down and apply it consistently. No external standard exists to defer to, and knowing that is liberating.
The question everyone gets stuck on
One marketer in a small B2B team described the problem precisely. They could point to roughly 37 percent of deals sourced by marketing and another 60 percent influenced, then found the basic ROI calculation came out at around negative 85 percent.
Their question was the right one. How deep into costs do you go, and do salary and tools belong in there or count as the cost of doing business?
That question rarely gets an answer, which makes every instruction to prove ROI impossible to follow.
The accounting profession looked at this and handed it back
Here is where the earlier fact returns. When the FASB wrote ASU 2024-03 and required public companies to disclose total selling expenses, it deliberately did not define selling expenses. KPMG describes it plainly as a management-defined category.
Companies determine their own definition, disclose it, apply it consistently, and recast prior periods if they change it.
So the reason nobody can tell you whether salary belongs in your denominator is not that marketers are sloppy. Accounting standard setters examined the same question, for public companies, with auditors involved, and concluded it cannot be defined centrally.
They attached three conditions instead, and those conditions are your method:
- Define it. Decide what your marketing cost base includes.
- Disclose it. State that definition every time you present a return figure.
- Do not change it without saying so. If you revise it, restate the prior periods too.
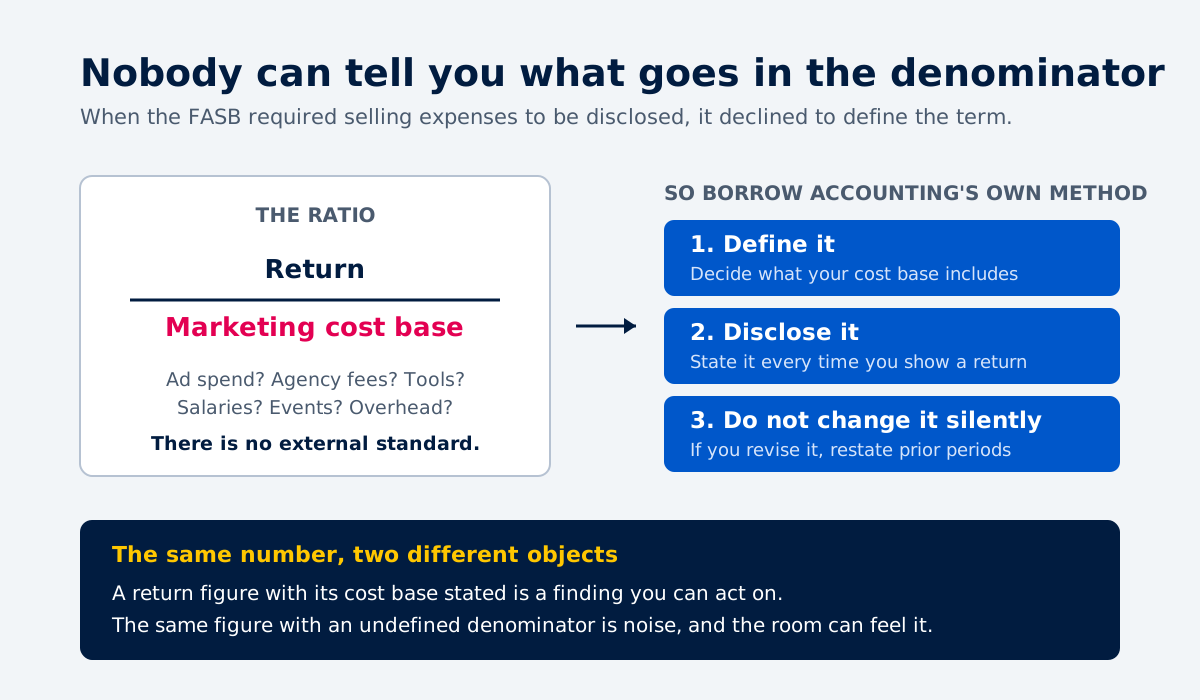
A negative 85 percent that arrives with its cost base stated is a real finding you can act on. The same number with an undefined denominator is noise, and everyone in the room feels that even without articulating why.
Why the ratio itself is a weak instrument
Once you have defined the cost base, it helps to know what the resulting ratio can and cannot tell you.
Dominique Hanssens, professor of marketing at UCLA Anderson, argues in an ANA piece that ROI works poorly as a primary instrument, for mechanical reasons:
- ROI is a ratio, while net cash flow is what matters. You divide to get ROI and subtract to get profit.
- ROI changes at different spending levels, so two channels compare only at equal spend.
- Maximum ROI does not produce maximum profit, because of diminishing returns.
- The decision turns on the last dollar, not the average.
Dale W. Harrison, writing from practice rather than research, adds three timing problems worth carrying into any calculation. This is an argued position rather than a study, though the logic holds.
Current-period marketing affects future-period revenue. Prior-period marketing affects current-period revenue. And marketing moves only incremental revenue, never total revenue.
His related distinction earns its place in a budget conversation. Effectiveness means causal incremental lift, and it must always answer "compared to what?". Efficiency is a rate, like cost per lead. Efficiency measures mean nothing until you establish effectiveness, because doing something ineffective cheaply is not a result. The same sorting problem shows up in which demand generation metrics are worth tracking at all.
Holding ourselves to the same standard
Our work with Westlab returned 869 percent on the content investment, and that figure means nothing without the two things this section has been arguing for.
A return figure is only as good as the cost base it divides by and the window it covers. Widen the cost base and the number falls. Extend the window and it rises. Neither movement tells you anything about the work.
State both, or the percentage is decoration. That applies to our numbers exactly as it applies to yours.
What the rigorous alternatives cost
If you want causal evidence rather than a ratio, the methods exist and carry real prices. These figures come from vendors and agencies selling measurement services, so treat them as ranges rather than facts.
Approach | Typical cost | Constraint |
Legacy econometric marketing mix modelling | $200K to $500K per engagement | Three to six months |
Open-source frameworks (Robyn, Meridian, PyMC) | No licence fee, often above $150K a year all-in | Needs data science headcount |
Hybrid SaaS measurement platforms | Roughly $5K to $25K a year at the low end | Ongoing data hygiene |
Geo-lift incrementality test | Cost of the spend you withhold | 14 to 30 days or longer, one channel at a time |
Two constraints matter more than the prices.
The practitioner floor for modelling sits around $3 million in annual spend across multiple channels. Bayesian methods lower it, with one vendor claiming stability from around $340,000 a year, though that claim comes from a company selling the approach.
The hidden cost is data preparation rather than analysis. One published analysis puts manual data preparation at a median of roughly 240 hours against about 20 hours of modelling, a ratio of better than ten to one.
For a long-cycle business there is one more design constraint. You have to model a leading outcome such as qualified pipeline rather than revenue, because revenue arrives too late to connect to the spend that caused it. Mapping how the demand generation funnel actually converts, by the numbers is the cheapest way to find which leading outcome is worth modelling.
How much of the pipeline can attribution honestly explain?
Less than you have been asked to deliver, and infrastructure sets the ceiling rather than effort.
We should be straight about the evidence. No published study puts a defensible number on achievable attribution coverage in a long-cycle, multi-stakeholder, partly offline B2B motion. Anyone quoting you a percentage is estimating.
The ceiling is infrastructure, and in this industry it barely exists
Attribution requires a system that captures identity, stores it, and connects it to a closed deal. Most companies here do not have that system.
In our research across pharma and biotech websites:
- Under 9 percent of sites run a detectable CRM, fewer than one in twelve.
- About 30 percent run a detectable analytics platform, mostly Google Analytics.
- Even above $500 million in revenue, CRM adoption reaches only about 29 percent.
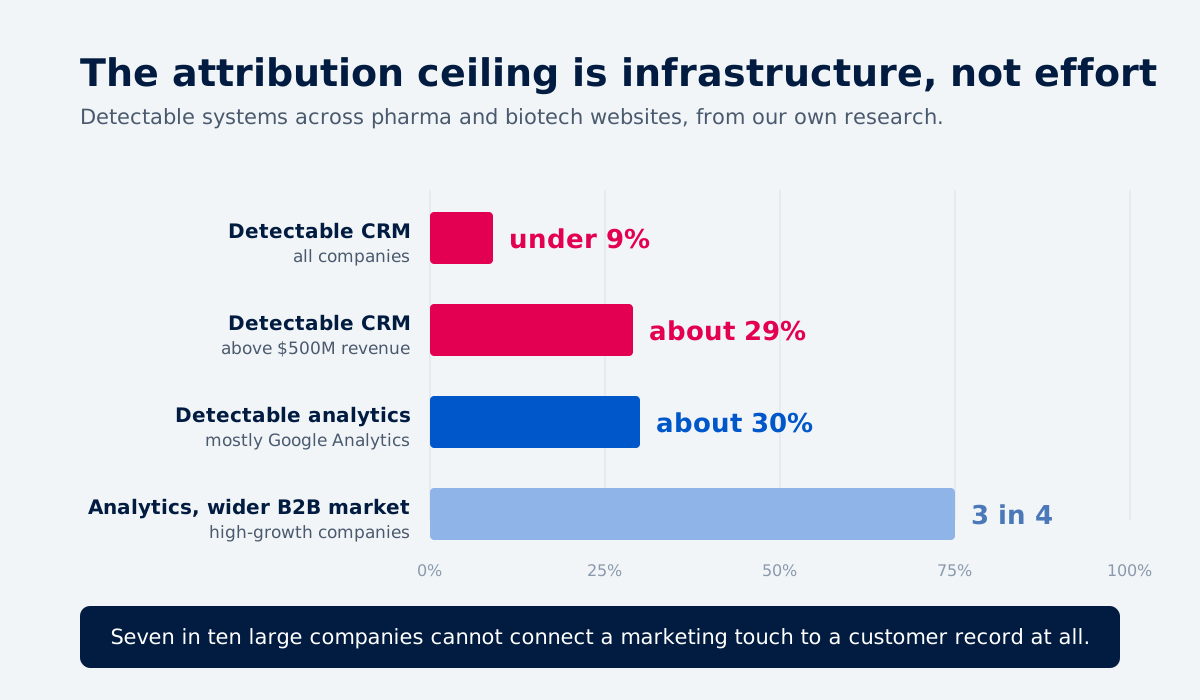
That last figure is the one to raise in a meeting, because it kills the assumption that scale solves the problem. Seven in ten large pharma and biotech companies have no detectable system for connecting a marketing touch to a customer record.
The contrast with the wider market sharpens it. Three in four high-growth B2B companies run Google Analytics. Most of the market measures traffic. Whether that traffic connects to pipeline is a separate question, and a page tag has never answered it. Closing that gap is a plumbing job before it is a reporting one, which is why lead capture and qualification comes before any attribution conversation.
What attribution models actually produce
A second limit exists that infrastructure will not fix.
Multi-touch attribution outputs are correlations. A model observes that a contact touched several things before converting, then assigns fractional credit according to a rule someone chose. Harrison makes this point directly, calling attribution models an attempt to assign causality by guessing, and Hanssens reaches the same place through incrementality.
Both sources point the same way. The only method that isolates causal lift is a controlled holdout, where you withhold spend from a comparable group and measure the difference. Modelling steers decisions inside channels that experiments have already validated.
What to say when you are asked for the number
A practitioner in one of these conversations put the honest position well. If leadership wants attribution coverage up to around half of sales, they need to fund the infrastructure and the people to track it. If they want 100 percent, they cannot have it at any price.
That is the sentence, and it does not read as evasion because it arrives with a price attached. You are quoting the cost of the measurement they are asking for, in tooling, in data engineering hours, and in elapsed time, using the figures in the previous section.
Then you tell them what you will commit to instead. If you are in pharma specifically, our guide to pharma marketing analytics sets out the minimum stack that connects content to pipeline, and what to install first.
Which numbers survive scrutiny from a scientific executive?
Leading indicators reported as changes rather than levels, chosen to sit inside the time horizon over which anyone has shown such indicators predict anything.
Practitioners in this industry describe the audience problem the same way. A dashboard of impressions and click-through rates lands with a scientific or clinical executive roughly the way results presented without controls would. We design measurement for that reader on the assumption they will interrogate the method, and the research below suggests they should.
Popular metrics can have no predictive value at all
Morgan and Rego, publishing in Marketing Science, tested six widely used customer feedback metrics against COMPUSTAT and CRSP measures of business performance across 1994 to 2000.
They found that average satisfaction scores had the greatest predictive value, that top-two-box satisfaction also performed well, and that metrics based on recommendation intentions and behaviour had little or no predictive value. Their stated conclusion is that prescriptions to focus measurement solely on customers' recommendation intentions are misguided.
Whether a metric predicts anything is therefore an empirical question with an answer, and some popular answers come back negative.
Leading indicators have a predictive horizon
This is the finding that explains the failure better than anything else here.
Across this literature, customer mindset metrics predict firm performance only over short lags.
Morgan and Rego found the relationship holds over one to three quarters. Williams and Naumann found the strongest effect at a single quarter. Comparing lags of one to three years, van Doorn and colleagues found one year performed best, with the relationship weakening beyond it, as synthesised in a 2021 Journal of the Academy of Marketing Science paper.
Now set that against a buying process that practitioners in this industry routinely describe in years rather than quarters, running through committees rather than individuals.
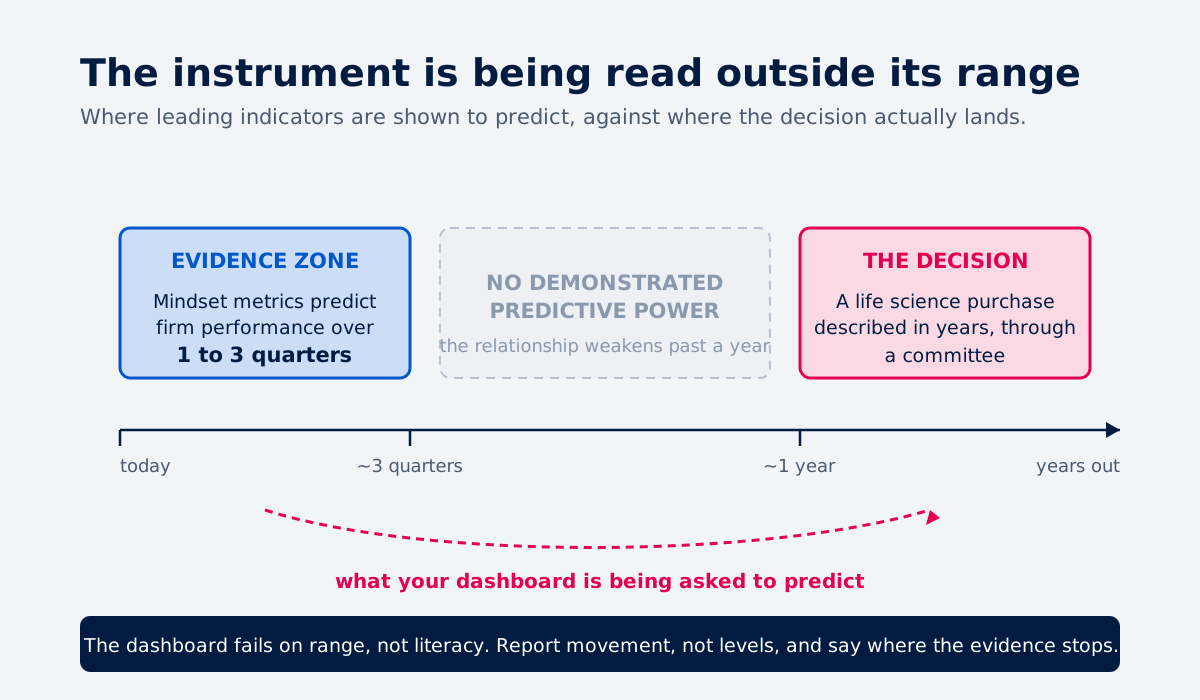
Your leading indicators are being asked to predict revenue at a distance where nobody has demonstrated they predict anything. The dashboard fails because the instrument gets read outside its range, not because your executives lack marketing literacy.
Saying that out loud, to an audience trained in method, tends to land better than adding another confidence interval to the same slide. It is also why the way we report and read market insights separates what an indicator can carry from what it cannot.
Measure the change, not the level
The same body of research offers two corrections that cost nothing to adopt.
A study in the Journal of the Academy of Marketing Science tracking seven brands over five years found that only changes in a mindset metric predicted future sales growth. Static levels did not, and brands with high scores did not grow unless the score improved.
Comparing metrics head to head in that study, net promoter score and brand consideration performed equally well at an adjusted R-squared of 0.350, marginally ahead of brand awareness at 0.345 and purchase intent at 0.331. The metric worked only when captured across all potential customers rather than existing ones.
That study covers seven brands in one industry, so read it as a principle rather than a benchmark.
Read alongside Morgan and Rego, it also shows why these findings need care. The two studies disagree about net promoter score. The likely reasons are that they measured different outcome variables three decades apart, and that the later one only found an effect when tracking movement rather than level.
The transferable principle survives both. Track movement rather than position, and measure consideration across the market you want rather than satisfaction among people who already bought.
For the firm-level link, a meta-analysis in Marketing Letters pooling 535 correlations from 245 articles, with a combined sample above 1.1 million, found customer satisfaction positively associated with sales, profit, and return on assets, with the satisfaction-to-retention relationship notably stronger in B2B than in B2C. The effects are real and modest.
What we would instrument in a life science business
Here we are giving you our view rather than a finding, and we will say so plainly. We could not locate research validating life-science-specific leading indicators, so what follows is how we would build the set, not something the literature has tested.
The logic is to pick indicators sitting closer in time to the decision than revenue does:
- Consideration-set membership before an RFP, measured by asking.
- Named-account penetration, meaning how many people inside a target account you have reached.
- Evidence and documentation request rate, since asking for the clinical or technical pack signals real intent.
- Spec-in and quote conversion, capturing the moment a product enters a protocol or specification.
- Distributor and channel pull-through, where a partner holds the relationship.
- Conference-meeting-to-opportunity conversion, since congresses remain the centre of commercial contact.
Each needs a baseline before it means anything, which argues for instrumenting them now rather than at the next budget cycle. Where those baselines sit relative to the rest of the sector is what our life sciences benchmark data was built to answer.
Engagement signals are the version that already works
The closest thing we have to proof of the approach comes from our own engagements. In one life science manufacturing business selling to laboratories, the readiness and engagement signals coming out of the content hub told the sales team which leads were genuinely serious.
That distinction is the whole problem in miniature. In a lead count, a scientist reading out of professional curiosity looks identical to a qualified prospect, and a number that cannot separate them cannot support a budget conversation.
Signals tracking behaviour over time can separate them, because they measure movement rather than a moment.
The market has already repriced this role
One last piece of evidence that the shift is underway rather than theoretical.
In our analysis of 1,000 demand generation leadership job postings, 52 percent name revenue, 37 percent name pipeline, and 18 percent explicitly describe owning a number.
Companies already hire the senior marketing role against financial accountability rather than activity. Bringing them an investment case, a defined cost base, a stated attribution ceiling, and indicators that work inside their own horizon is how you meet that standard on your own terms.
Could you put a stage-gated case for marketing in front of your CFO next week?
Get a Content RevOps audit, your cost base defined, your attribution ceiling priced, and every gap quantified with the assumptions printed next to it so finance can argue with the inputs instead of the ask.
Frequently Asked Questions
About the Author

Founder & CEO, Content RevOps
Stefan Kalpachev is the founder and CEO of Content RevOps, where he helps B2B SaaS companies transform their content into predictable pipeline. With a background in content marketing and revenue operations, Stefan has developed a unique methodology that bridges the gap between content creation and revenue generation.
Connect on LinkedIn